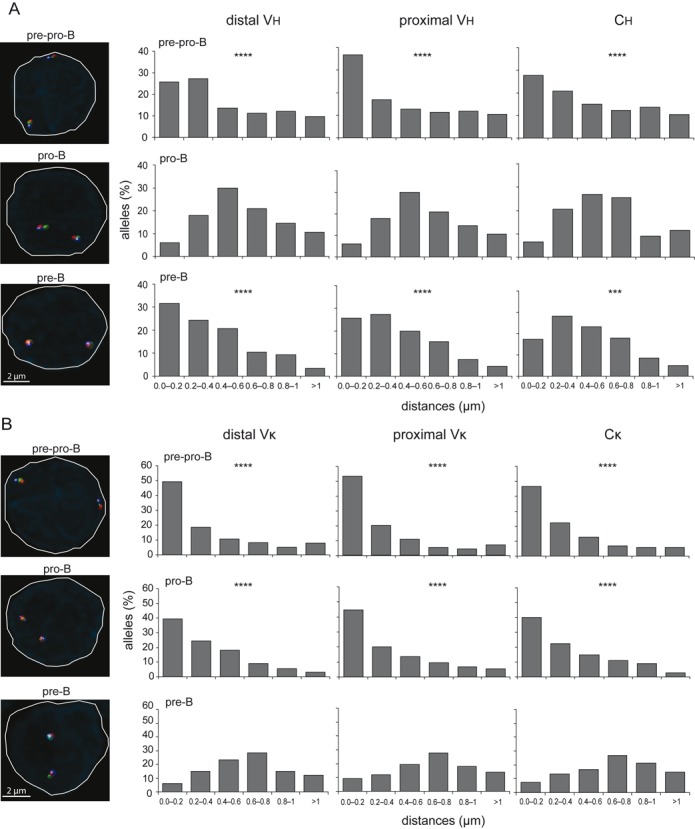
Figure 4.

Stage-specific positioning of Ig loci away from the nuclear lamina. (A) Bar graphs showing the frequencies of Igh alleles positioned within a distance range from the nuclear lamina in cultured E2A−/− pre-pro-B, Rag1−/− pro-B and Rag1−/− hIgM pre-B cells. (B) Bar graphs depicting frequencies of Igκ alleles positioned within a distance range from the nuclear lamina in cultured E2A−/− pre-pro-B, Rag1−/− pro-B and Rag1−/−hIgM pre-B cells. In A and B, X-axis represents the distance ranges from the nuclear lamina and Y-axis represents the% of alleles positioned with a certain distance range. Distances were measured with 3D DNA FISH of >100 alleles, obtained from 2 mice. Statistical significance was calculated with the χ2 test between Rag1−/− pro-B and E2A−/− pre-pro-B and Rag1−/−hIgM pre-B cells in (A) or between Rag1−/− hIgM pre-B and E2A−/− pre-pro-B and Rag1−/− pro-B cells in (B) based on the sum of alleles located <0.4 μm from the lamina and the sum of alleles located >0.4 μm of the lamina. Significant changes in distribution of distances were calculated with the χ2 test; ***, P < .001; ****, P < .0001. Representative microscope images on the left indicate differential nuclear positioning of Ig loci in the three precursor-B-cell populations.
