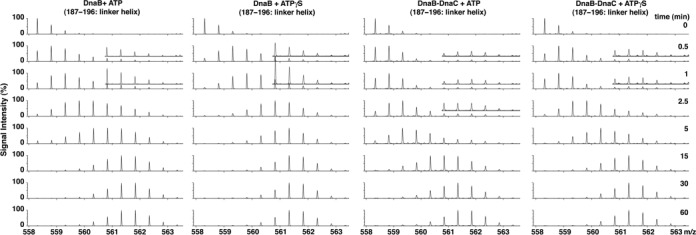
Figure 3.

Bimodal exchange kinetics of the DnaB linker helix in the BC complex. Mass spectra show the abundances of ions with various mass/charge (m/z) values at the indicated times for the DnaB peptide (amino acids 187–196) in DnaB, or the BC complex in the presence of ATP or ATPγS. The bimodal isotopic distributions, which were also observed in raw mass spectra for lesser charge states (data not shown), indicate the presence of two populations of the DnaB linker helix. The vertical axes of peptides greater than m/z 561.346 (+2 charge state) of the respective spectra have been magnified three-fold.
