Figure 2.

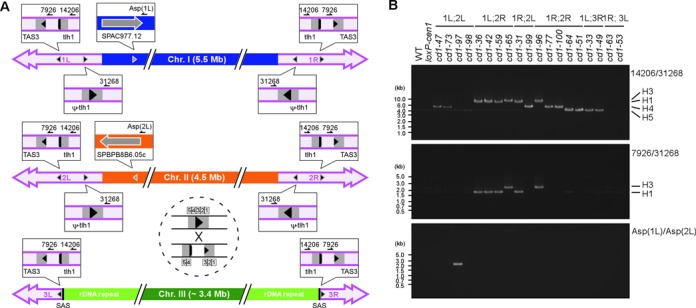
Chromosome fusion-point mapping in the Δcen1 survivors. (A) A schematic diagram of candidate fusion points along the fission yeast chromosomes. The approximate positions and relative orientations of the fusion points in each chromosome are represented by grey arrowheads, and the individual details are shown in the enlarged balloons. A crossover event is exemplified within the dashed circle. The positions of the primers used for gPCR are indicated by half arrows in the balloons. The following nearby genes are also shown: tlh1, telomere-linked helicase (typically SPAC212.11); and ψ-tlh1, a gene sharing DNA sequence homology with tlh1 (typically SPAC212.06c). The homology segment at the telomere-proximal region is drawn as though it is segregated into two parts; however, as indicated in the dashed circle, the region actually comprises five separate parts (H1–H5) (43), with the largest interval between H3 and H4. SAS is a chromosome III-specific sequence demarcating the subtelomere and rDNA repeats (see Supplementary Figure S5). (B) A gPCR analysis demonstrating the fusion between subtelomere segments (14206/31268 and 7926/31268) and L-asparaginase genes (Asp(1L)/Asp(2L)). The position of each primer is indicated in (A). Note that the size variation among the subtelomeric gPCR products reflects the actual crossover position, which is indicated at the right-hand side of the gels, and that the 7926/31268 gPCR was effective only when the crossover occurred at either H4 or H5.
