Fig. 1.

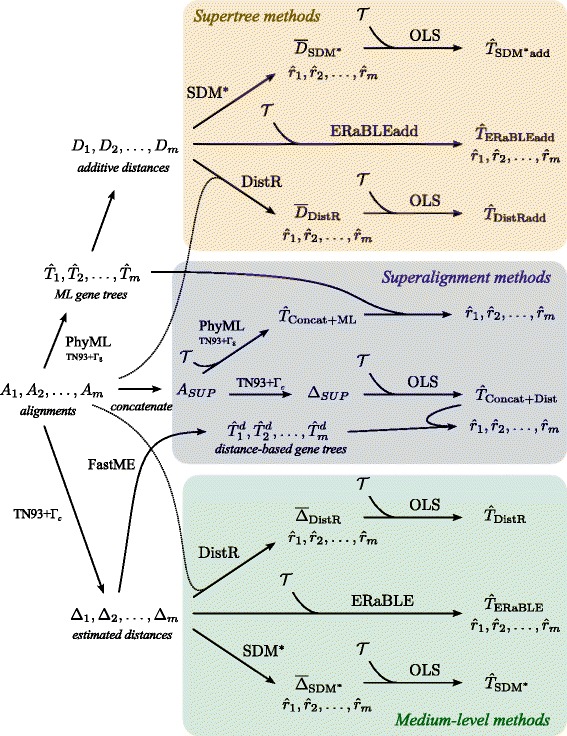
Pipelines of the analyses applied to both data sets, represented as flowcharts. We refer to the “Analysis protocol” subsection for a detailed description of each analysis method

Pipelines of the analyses applied to both data sets, represented as flowcharts. We refer to the “Analysis protocol” subsection for a detailed description of each analysis method