
Fig. 4.
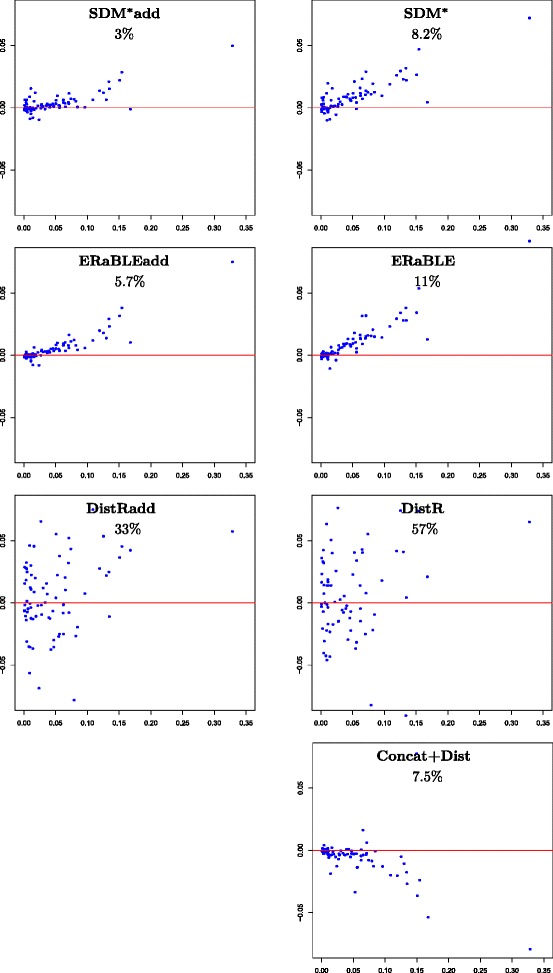
Accuracy of branch length estimates in the OrthoMaM data set. For each method, the 77 branch lengths estimated by Concat+ML (x-axis) are plotted against the differences (y-axis) (where is the estimate for the length of e obtained by the method at the top of the plot). The horizontal red line corresponds to no difference between the two estimates. Method names are shown at the top of each plot, followed by the fraction of variance unexplained of relative to (see Additional file 3)