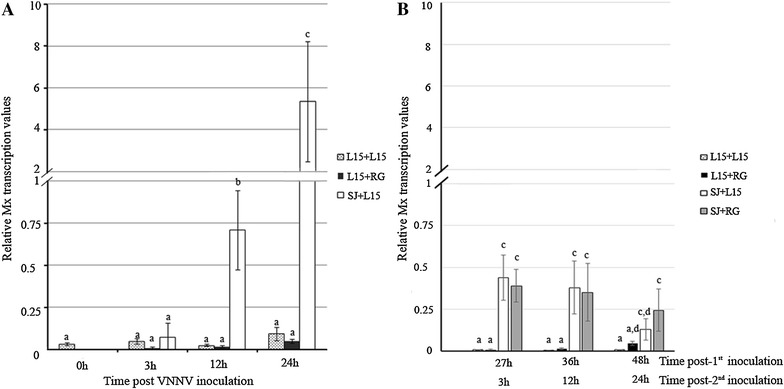
Figure 3.

Relative Mx transcription in head kidney sampled during challenge 1. A Relative Mx mRNA values after single VNNV inoculation. B Relative Mx mRNA values after the second inoculation. Graphics represent the mean relative values and standard deviation of three independent samples collected from different experimental groups. Different letters indicate significant differences between groups as well as between samples collected throughout time within each group (p < 0.05).
