Fig. 3.

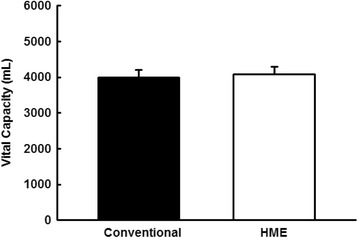
Graphic representation of vital capacity in both maneuvers. Vertical bar graphs representing the mean ± standard deviation, evaluated in a conventional manner or with the addition of an HME (p = 0.116; compared between maneuvers)

Graphic representation of vital capacity in both maneuvers. Vertical bar graphs representing the mean ± standard deviation, evaluated in a conventional manner or with the addition of an HME (p = 0.116; compared between maneuvers)