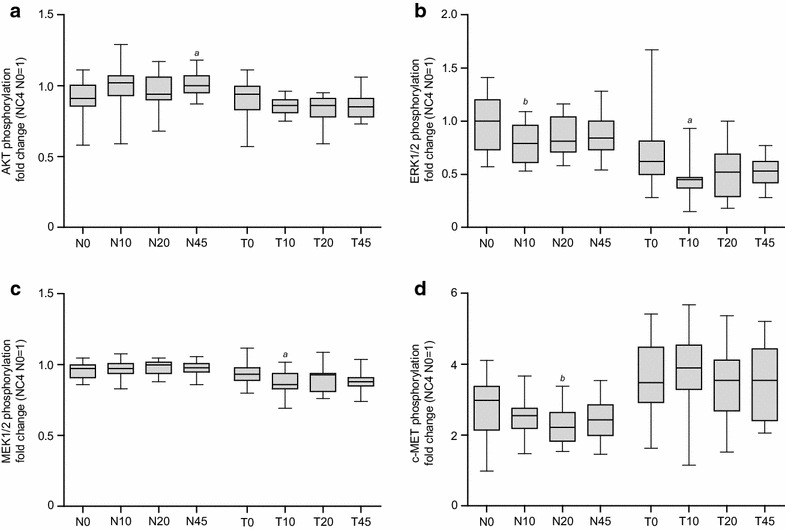
Fig. 4.

Changes in phosphorylation of AKT, ERK1/2, MEK1/2, and c-MET in response to ischemia. Time-dependent changes in phosphorylation of AKT (a), ERK1/2 (b), MEK1/2 (c), and c-MET (d) in normal (N) compared with tumor (T) tissue from 20 patients are shown by box-and-whisker plots. Boxes represent first and third quartile, whiskers represent minima and maxima, solid lines within boxes indicate medians. Results were displayed as fold changes normalized in normal tissue to sample NC4/N0 and in tumor tissue to sample NC4/T0. Kruskal–Wallis test and Dunn test for multiple comparisons or analysis of variance (ANOVA) were used for statistical analysis. N normal tissue, T tumor tissue, 0 before surgery, 10, 20, 45 10, 20, 45 min after resection; a p ≤ 0.05; b p ≤ 0.01
