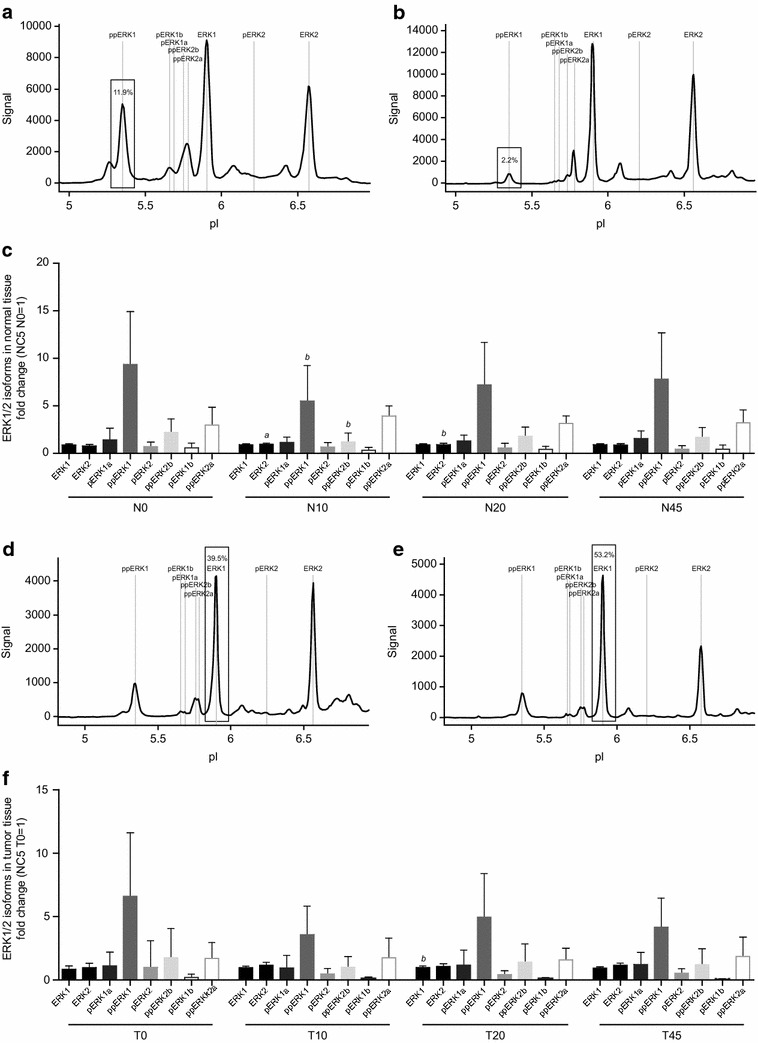
Fig. 6.

Changes in isoform phosphorylation of the target signaling protein, ERK1/2, in response to ischemia. Representative spectra of time-dependent changes in the ppERK1 isoform phosphorylation of ERK1/2 between N0 and N10 in normal tissue are shown in a and b. An overview of all isoforms of ERK1/2 in normal tissue of all patients analyzed is shown in c; therein results were displayed as fold changes normalized in normal tissue to sample NC5/N0 and in tumor tissue to sample NC5/T0. The same graphs are shown for time-dependent changes in the ERK1 isoform between T0 and T20 in tumor tissue (d, e). An overview of all isoforms of ERK1/2 in tumor tissue of all patients analyzed is shown in f. Kruskal–Wallis test and Dunn test for multiple comparisons or analysis of variance (ANOVA) were used for statistical analysis. N normal tissue, T tumor tissue, 0 before surgery, 10, 20, 45 10, 20, 45 min after resection; Time points (10, 20, 45) are compared with time point 0; a p ≤ 0.01; b p ≤ 0.05
