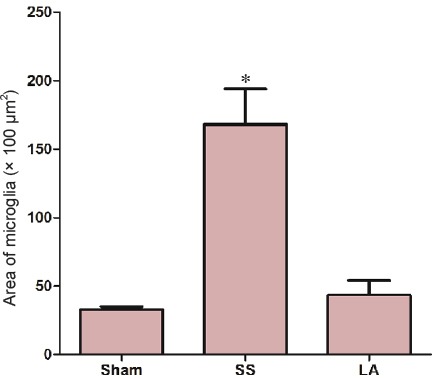
Figure 5.

Density of microglial cells in spinal cord of rats with spinal cord injury after LA treatment.
Micrographs from top to bottom show a representative image of sham, SS and LA groups, respectively. Immunoreactivity for ionized calcium binding adapter molecule 1 is shown by arrows. Graphic represents the analysis of values obtained from density quantification (n = 3 by triplicate) at the 5th week. *P < 0.05, vs. LA (n = 9, 11 and 10 for sham, SS and LA groups, respectively).
