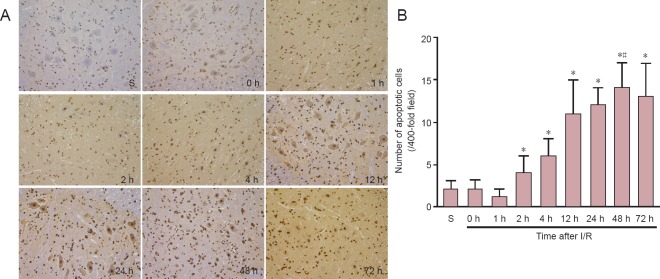
Figure 3.
Apoptosis in the spinal cord of rats with ischemic spinal cord injury.
(A) TUNEL staining of spinal cord from rats in the S and I/R groups at different time points after reperfusion (0–72 hours) (× 400). Positive reaction of TUNEL staining shows a brown color. (B) Number of apoptotic cells at different time points after reperfusion. Data are expressed as the mean ± SD of 10 rats in each group at each time point. One-way analysis of variance was used. *P < 0.05, vs. sham group; #P < 0.05, vs. I/R at all other time points. TUNEL: Terminal deoxynucleotidyl transferase-mediated deoxyuridine triphosphate nick-end labeling; I/R: ischemia/reperfusion; S: sham; h: hour(s).

