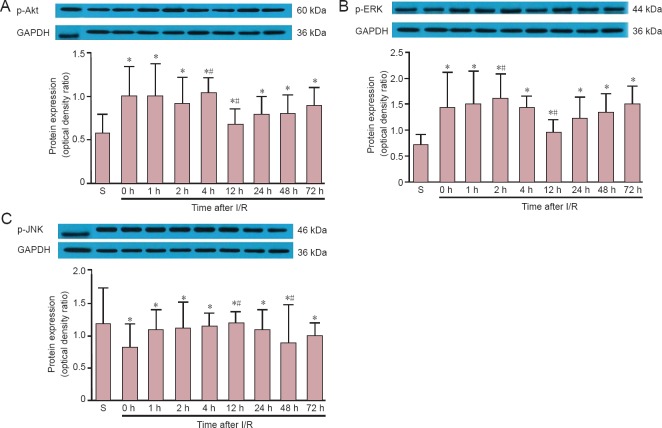
Figure 4.
p-Akt (A), p-ERK (B) and p-JNK (C) protein expression in S and I/R groups at different time points after reperfusion (0–72 hours).
Data are expressed as the mean ± SD, with 10 rats in each group at each time point. The data were compared using oneway analysis of variance. *P < 0.05, vs. S group; #P < 0.05, vs. I/R groups at all other time points. p: Phosphorylated; Akt: serine-threonine kinase; ERK: extracellular signal-regulated kinase; JNK: c-Jun N-terminal kinase; S: sham; I/R: ischemia/reperfusion; h: hour(s).

