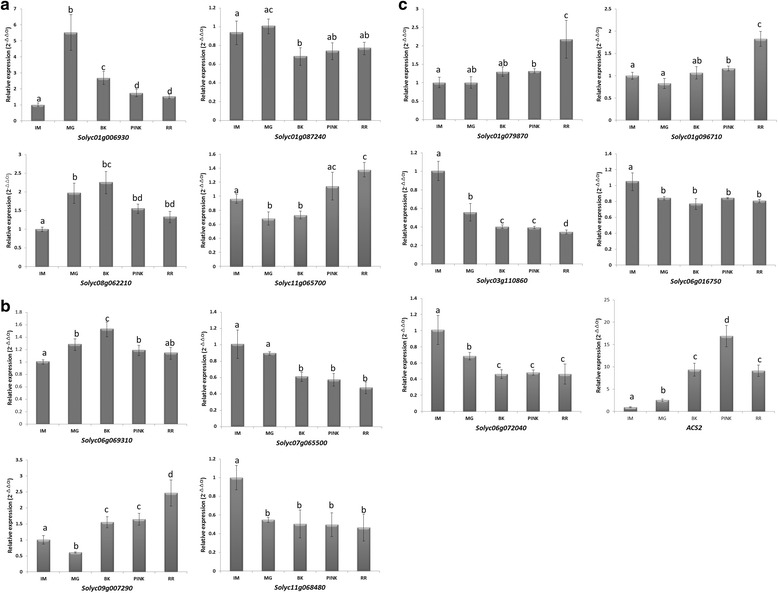
Fig. 3.

Expression of tomato NF-Y genes during fruit ripening. Figures are grouped into (a) NF-YA, (b) NF-YB, (c) NF-YC. Relative transcript levels are shown, as determined by quantitative real time RT-PCR, relative to the expression of the tomato ACTIN gene, expressed as 2-△△Ct [43]. The stages of fruit ripening were: Immature (IM), Mature Green (MG), Breaker (BK), Pink (PK), and Red Ripe (RR). Significance values were based on comparisons of expression levels at different ripening stages with expression at the IM stage. Expression levels of the tomato ACS2 gene were used as a positive control. Lowercase letters above the bars indicate values with a significant difference, which were determined by Student’s t-test (* = P < 0.05;** = P < 0.01)
