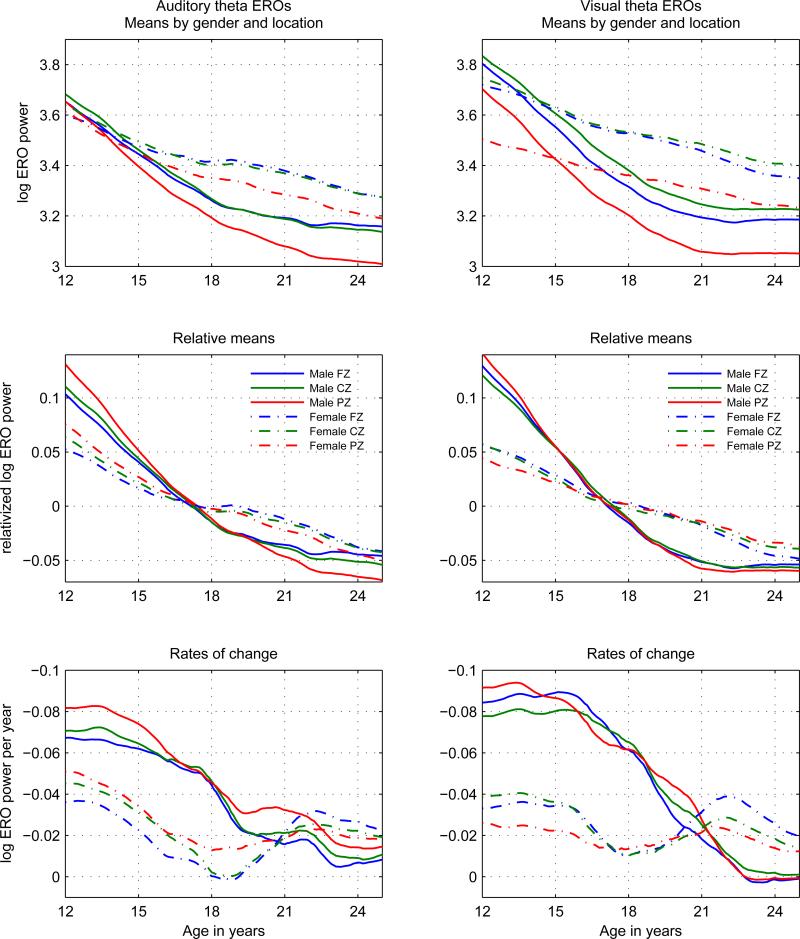
Figure 1.
Theta ERO total power trajectory means (s(t)) in auditory (left column) and visual (right column) modalities presented in three views: Top row: Development curves: log(s(t)). Middle row: Relative development curves:s̃(t) = (log(s(t)) − mean(log(s(t))))/mean(log(s(t))). Values are shown as relative to the mean value of the trajectory over the entire age range of 12 to 25. Plots of relative values emphasize similarities and differences in overall shape, rather than in values. Bottom row: Rates of change of development curves: dlog(s(t))/dt = (ds(t)/dt)/s(t). Each line in this graph represents the slope of the corresponding line in the graph in the top row at the corresponding age. The y-axis is inverted in order to more clearly illustrate the decrease in absolute value of the slopes with time. All line styles and colors of the graphs follow the legends in the middle row.

