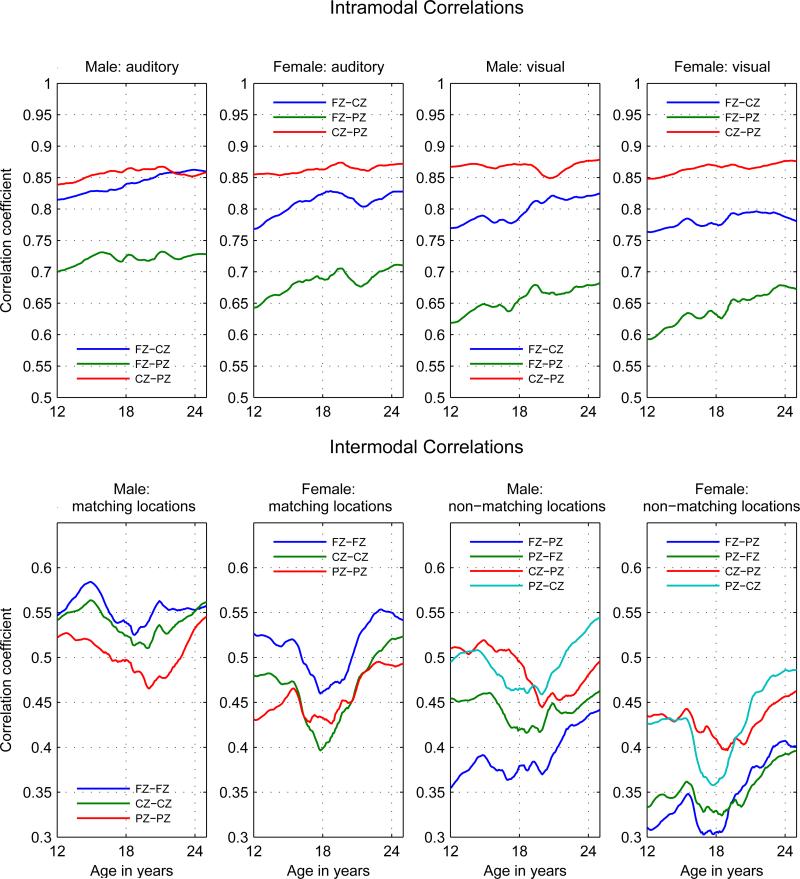
Figure 2.
Intramodal and Intermodal Phenotypic Correlations. Intramodal correlations in top panel: Left Columns: Auditory correlations; Right Columns: Visual Correlations. Intermodal correlations in bottom panel: Left Columns: Matching locations; Right Columns: Non-matching locations. (For non-matching locations the first electrode is the auditory, the second the visual.) Note that the scales are different between in the top and bottom panels.

