
Figure 2.
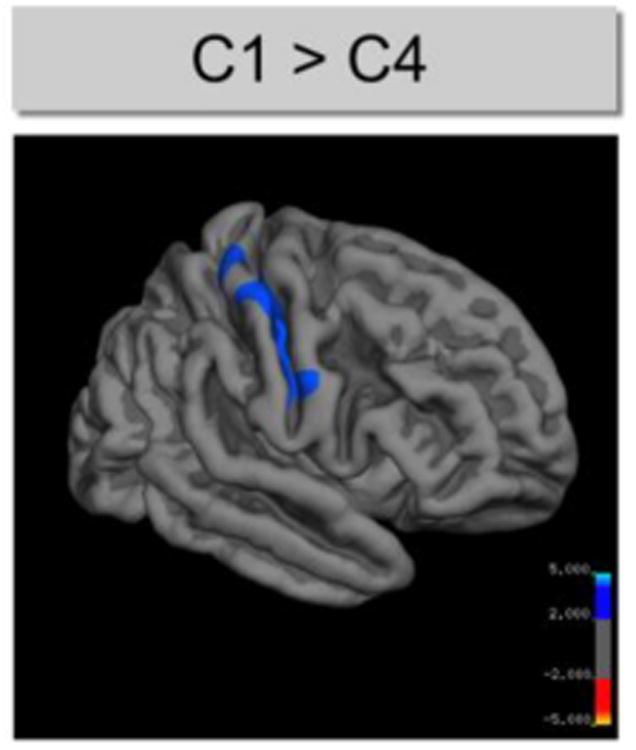
Structural differences between schizophrenia clusters. The cortical statistical map displays regions of reduced thickness (indicated by blue color) in the right hemisphere of schizophrenia patients of cluster 4 compared to cluster 1. CWP-values (corrected for multiple comparisons) are represented according to the color code and are all < 0.05.