Figure 2.
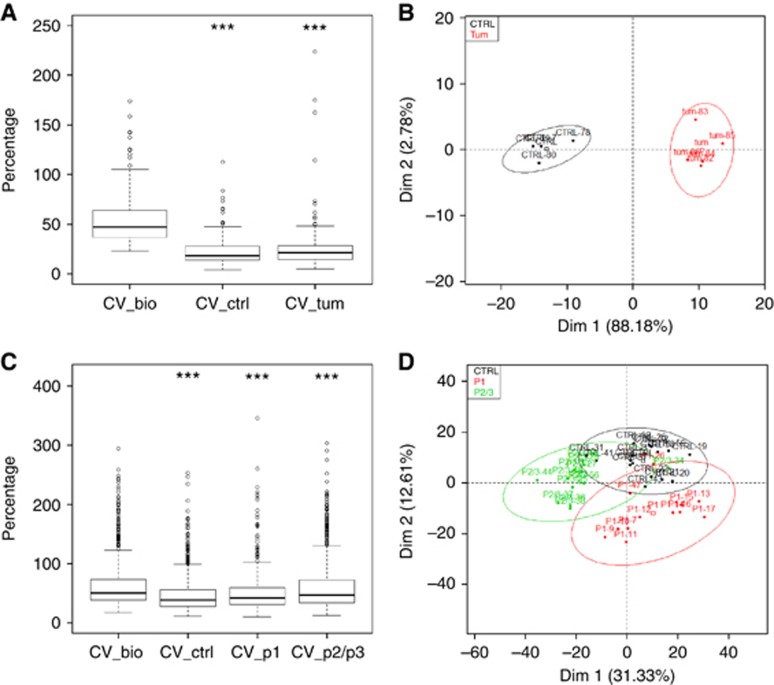
PCA analysis from plasma samples submitted to CE-MS analysis. (A) Box plots representative of intra-groups and inter-groups CV (in percentage) from control mice (ctrl) and PDAC-bearing mice plasmas in comparison with biological CV (CV_bio) of all samples taken together. ***P<0.001 adjusted from Tukey's test, in comparison with CV_bio. (B) Score plots from results of PCA of peptide profiles from control mice (black, n=4) and PDAC-bearing mice (red, n=5) plasmas according to the first two principal components (Dim 1: 88.18% Dim 2: 2.78%). Confidence ellipses at 95% around each samples from each group are also represented. Colour code is used to distinguish samples in accordance to their group memberships. (C) Box plots representative of intra-groups and inter-groups CV (in percentage) from control mice (ctrl) and PanIN-bearing mice plasmas (p1, p2/3) in comparison with biological CV (CV_bio) of all samples taken together. ***P<0.001 adjusted from Tukey's test, in comparison with CV_bio. (D) Score plots from results of PCA of peptide profiles from control mice (black, n=16), PanIN1-bearing mice (red, n=12) and PanIN2/3-bearing mice (green, n=12) plasmas according to the first two principal components (Dim 1: 31.33% Dim 2: 12.61%). Confidence ellipses at 95% around each samples from each group are also represented. Colour code is used to distinguish samples in accordance to their group memberships.

