Figure 3.
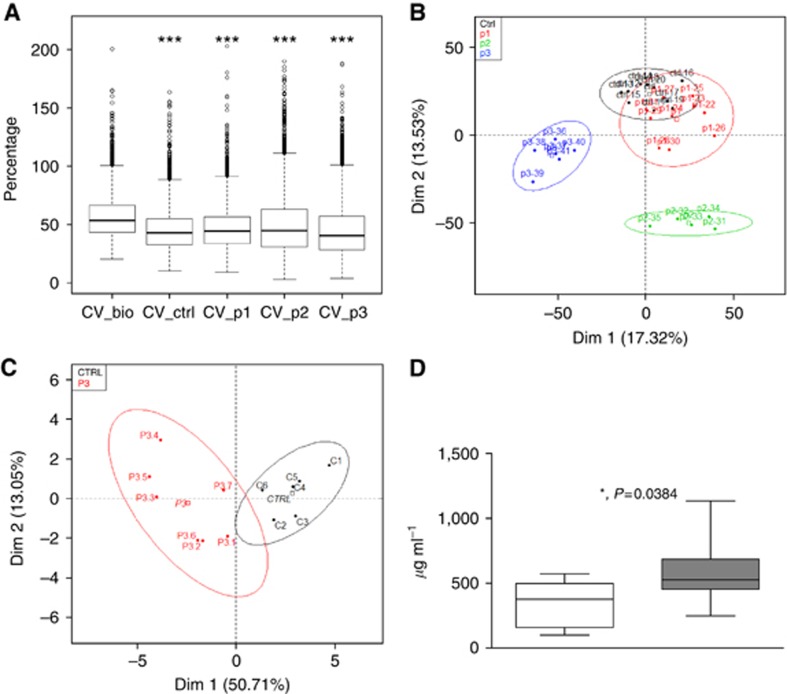
Analysis of plasma samples submitted to Chip-MS analysis. (A) Box plots representative of intra-groups and inter-groups CV (in percentage) from control mice (ctrl) and PanIN-bearing mice plasmas (p1, p2, p3) in comparison with biological CV (CV_bio) of all samples taken together.***P<0.001 adjusted from Tukey's test, in comparison with CV_bio. (B) Score plots from results of PCA of peptide profiles from control mice (black, n=10), PanIN1-bearing mice (red, n=10), PanIN2 (green, n=5) and PanIN3-bearing mice (blue, n=12) plasmas according to the first two principal components (Dim 1: 17.32% Dim 2: 13.53%). Confidence ellipses at 95% around each samples from each group are also represented. Colour code is used to distinguish samples in accordance to their group memberships. (C) Score plots from results of PCA of peptide profiles from control mice (black, n=6) and PanIN3-bearing mice (red, n=7) plasmas according to the first two principal components (Dim 1: 50.71% Dim 2: 13.05%). Confidence ellipses at 95% around each samples from each group are also represented. (D) Quantitative analysis by Elisa of ITIH3 in the plasma of control mice (white box, n=5) and of PanIN3-bearing KC and KPC mice (grey box, n=13), *P<0.05.

