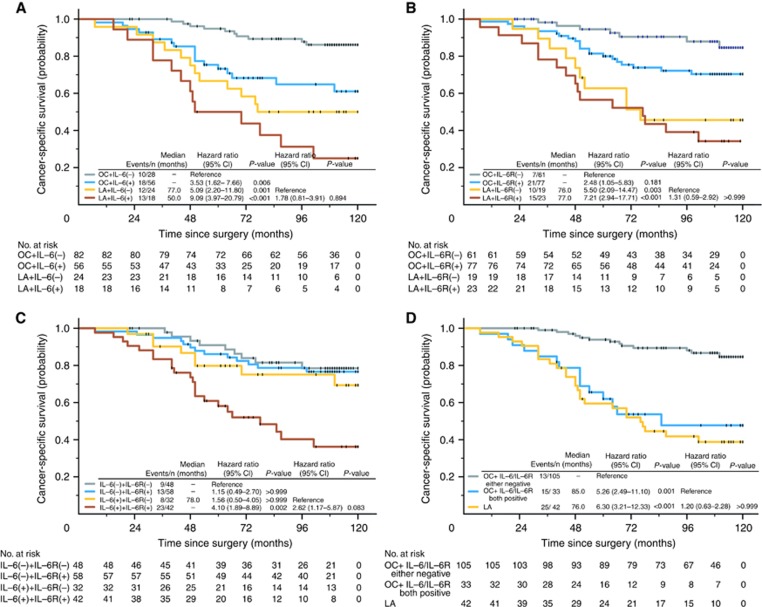
Figure 1.
Kaplan–Meier curves of 10-year cancer-specific survival for patients with localised ccRCC, stratified by (A) IL-6 and pT, (B) IL-6R and pT, (C) IL-6 and IL-6R and (D) IL-6, IL-6R and pT. To compare stratums in each panel, HR and 95% CI were obtained from univariate analyses for each categories, and relevant P′-values were obtained from pairwise log-rank tests after Bonferroni correction. OA, organ-confined (pT1-2N0M0 stage disease); LA, locally advanced (pT3-4N0M0 stage disease).

