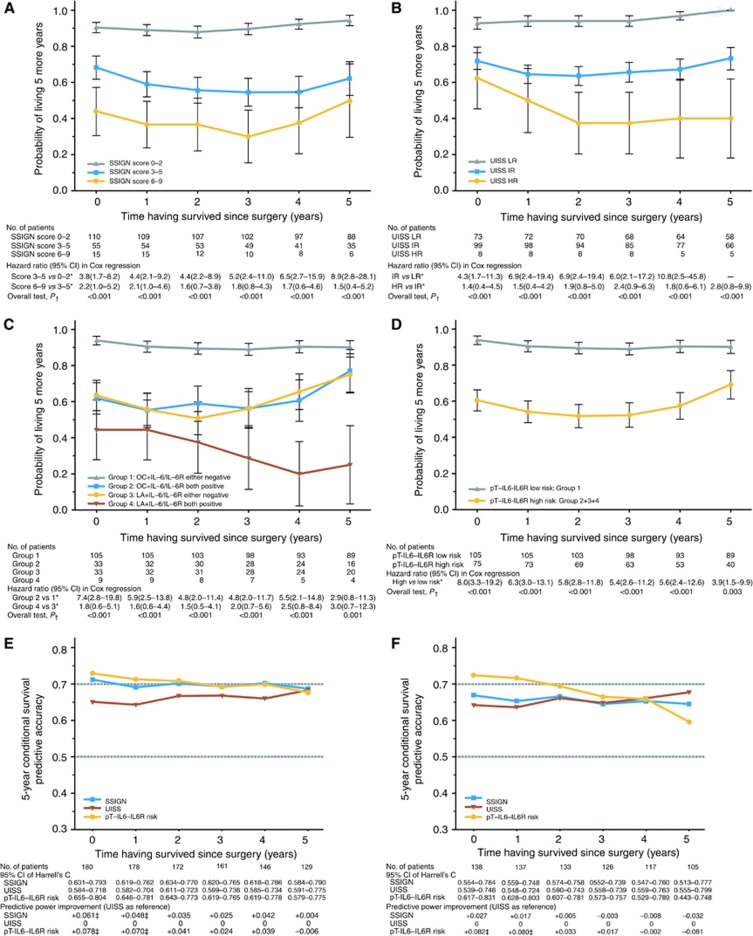
Figure 2.
5-year CCSS for all localised ccRCC patients stratified by (A) SSIGN, (B) UISS, (C) pT-IL-6-IL-6R risk, (D) pT-IL-6-IL-6R risk and the over-time discrimination of predictive power between these models (SSING, UISS and pT-IL-6-IL-6R risk) in (E) all population and (F) OC population. Harrell's concordance index (Harrell's C) and 95% CI obtained from 1000 bootstrap resamples was used to present the model's predictive accuracy. *The latter is the referential category. †P-values were obtained from pooled log-rank tests over strata for 5-year CCSS at each time point. ‡Significant in Hanley–McNeil test (P<0.05). HR, high risk; IR, intemediate risk; LR, low risk; UISS, the University of California Los Angeles Integrated Staging System; SSIGN, the stage, size, grade and necrosis.

