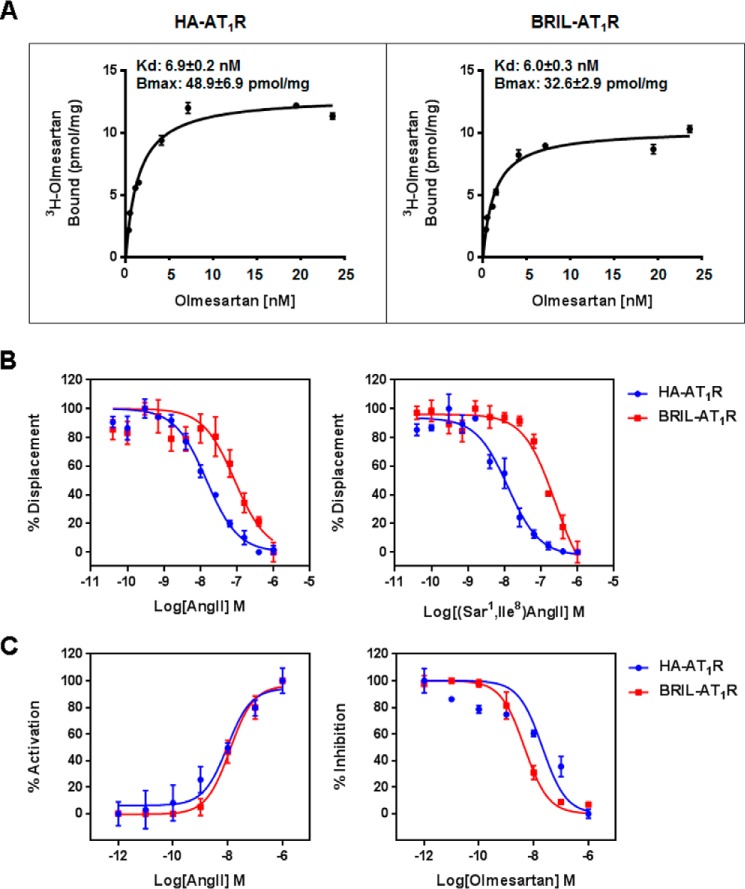
FIGURE 1.
Comparisons of the ligand binding and functional activities between the wild-type (HA-AT1R) and crystallized construct (BRIL-AT1R). A, binding of olmesartan to the wild-type HA-AT1R and crystallized BRIL-AT1R. Binding studies were performed using isolated membranes from transiently transfected COS1 cells. Saturation binding curves were measured using [3H]olmesartan, and the corresponding Kd and Bmax values were obtained by non-linear curve fitting. B, displacement of [3H]olmesartan with the agonist AngII and the antagonist [Sar1,Ile8]AngII in the wild-type HA-AT1R and the crystallized BRIL-AT1R. Binding studies were performed using isolated membranes from transiently transfected COS1 cells. Competition binding curves for peptide agonist AngII and peptide antagonist [Sar1,Ile8]AngII were generated, and the corresponding IC50 values were calculated. The IC50 values for AngII to inhibit olmesartan binding were 1.8 ± 0.2 and 18.4 ± 2.3 nm for HA-AT1R and BRIL-AT1R, respectively. The IC50 values for [Sar1,Ile8]AngII to inhibit olmesartan binding were 1.2 ± 0.1 and 25.5 ± 4.9 nm for HA-AT1R and BRIL-AT1R, respectively. C, intracellular calcium responses of wild-type HA-AT1R and BRIL-AT1R. AngII and olmesartan dose-response curves for HA-AT1R and BRIL-AT1R are shown. For the antagonist dose response, cells were treated with 0–10 μm concentrations of olmesartan followed by stimulation with 100 nm AngII. The EC50 values for AngII dose response were 10.2 ± 3.2 and 11.9 ± 3.1 nm for HA-AT1R and BRIL-AT1R, respectively. The IC50 values for olmesartan to inhibit AngII response were between 23.9 ± 8.0 and 4.4 ± 0.4 nm for HA-AT1R and BRIL-AT1R, respectively. All results above are presented as mean ± S.E. and represent three experiments performed in triplicate.

