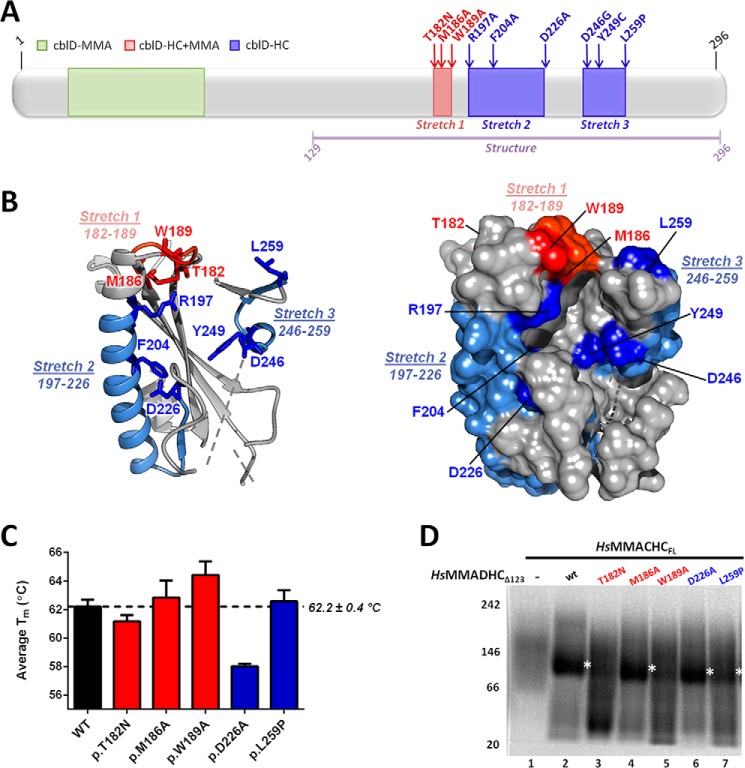
FIGURE 5.
Structural and biochemical analysis of MMADHC missense mutations. A, domain diagram of MMADHC, with missense mutations color-coded according to their cellular defects (10–12), namely MMA (green), combined HC+MMA (stretch 1, red), or HC (stretches 2 and 3, blue) phenotypes. Purple line indicates aa region observed in the crystal structure. B, graphic (left) and surface (right) representations of MmMMADHCΔ128 mapped with stretches 1–3 and individual mutations found within these regions. Dotted lines indicate disordered regions. C, analysis of thermal unfolding curves of various protein constructs reveals a melting temperature (Tm) of 62 °C (right) for HsMMADHCΔ123, which is relatively unchanged for all mutants with the exception of HsMMADHCΔ123-D226A where the Tm is slightly decreased as compared with wild type. Error bars indicate means ± S.E. D, interaction of HsMMACHCFL with wild-type or mutant HsMMADHCΔ123 studied by BN-PAGE. Depicted are: HsMMACHCFL with MeCbl and GSH alone (lane 1), and in combination with HsMMADHCΔ123 (lane 2), HsMMADHCΔ123-T182N (lane 3), HsMMADHCΔ123-M186A (lane 4), HsMMADHCΔ123-W189A (lane 5), HsMMADHCΔ123-D226A (lane 6), and HsMMADHCΔ123-L259P (lane 7). White asterisks indicate the MMACHC-MMADHC heterodimer.

