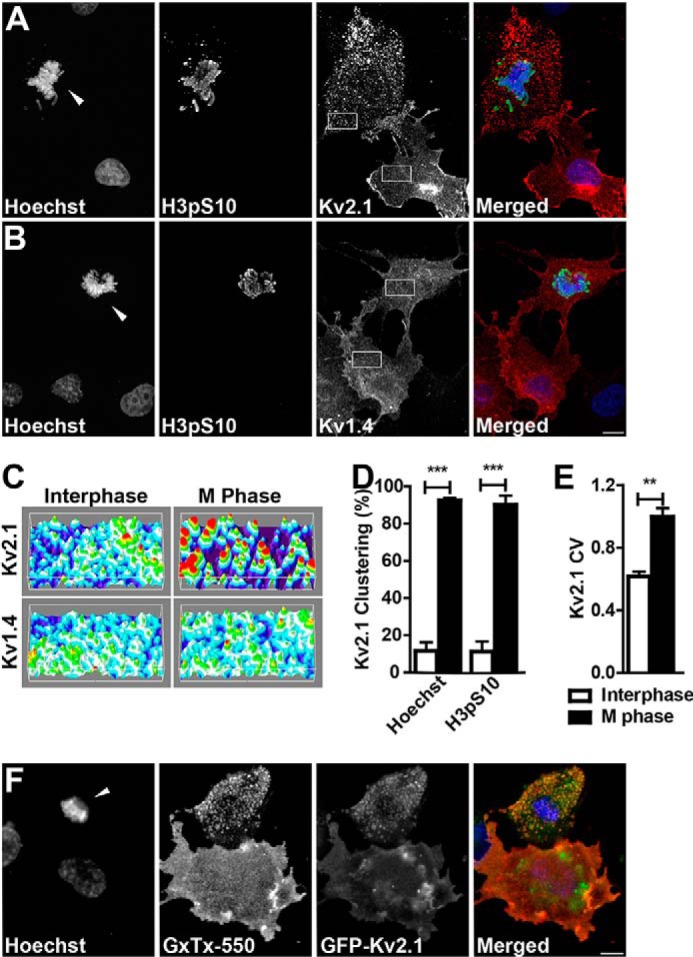
FIGURE 1.

M phase COS-1 cells cluster Kv2.1. A, M phase and interphase Kv2.1 expressing COS-1 cells stained with Hoechst (blue) and immunolabeled for H3pS10 (green) and Kv2.1 (red). B, M phase and interphase Kv1.4 expressing COS-1 cells stained with Hoechst (blue) and immunolabeled for H3pS10 (green) and Kv1.4 (red). Arrowheads indicate M phase nuclei. Scale bar, 10 μm. C, three-dimensional surface plots of the regions indicated in A and B showing relative Kv immunolabeling intensity plotted along the cell surface area. D, cells categorized as interphase (white bars) or M phase (black bars) were scored as either clustered or unclustered. Cells with over 25% of their membrane covered in clusters were considered clustered. Cell cycle stage was determined by either nuclear morphology as revealed by Hoechst staining (left two bars) or the presence of H3pS10 immunolabeling (right two bars). Data are from at least 20 cells in an n of three independent samples. E, coefficient of variation (CV) of Kv2.1 fluorescence intensity in interphase (white bar) or M phase (black bar) cells. Cell cycle stage was determined by nuclear morphology as revealed by Hoechst staining. Data are from at least 30 cells in an n of three independent samples. Data in D and E are the mean ± S.E. **, p < 0.01; ***, p < 0.001 (two-tailed unpaired t test). F, Live COS-1 cells expressing GFP-Kv2.1 (green) labeled with GxTX-550 (red) and Hoechst nuclear dye (blue).
