FIGURE 2.

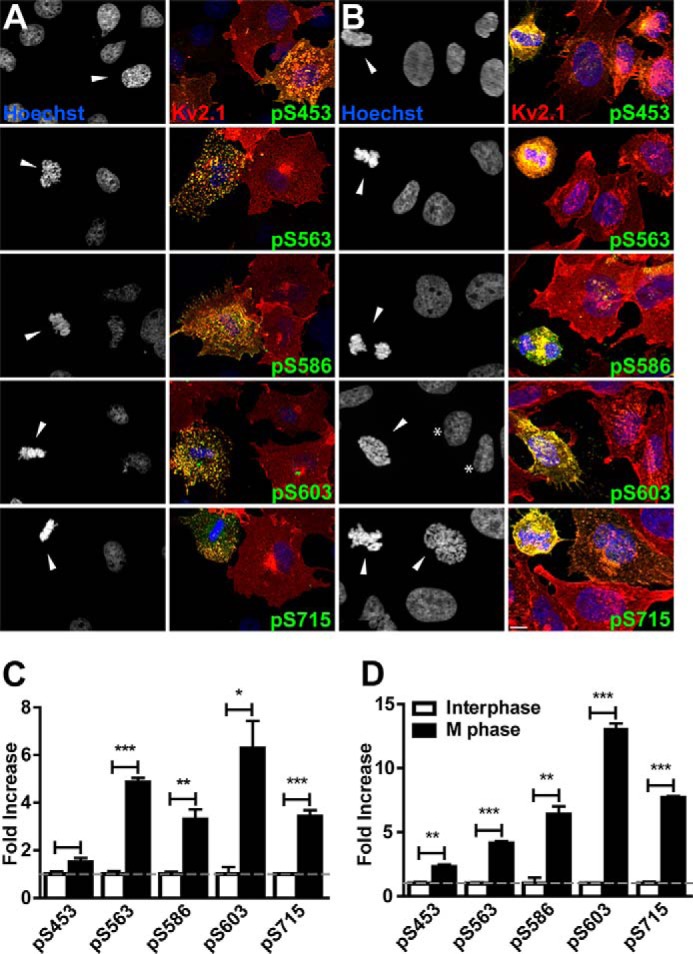
Kv2.1 is phosphorylated at M phase. Kv2.1 expressing COS-1 (A) and CHO (B) cells stained with Hoechst (blue) and immunolabeled for total Kv2.1 (red), and the indicated Kv2.1 phosphosite (green). Arrowheads indicate M phase nuclei. Asterisks in B denote interphase CHO cells with Kv2.1 clustering. Scale bar, 10 μm. The ratio of the fluorescence intensity of each Kv2.1 phosphosite to total Kv2.1 was measured in COS-1 (C) and CHO (D) cells in interphase (white bars) and M phase (black bars). Data are from at least 28 cells in an n of three independent samples. Values are normalized to interphase cells. Data are the mean ± S.E. *, p < 0.05; **, p < 0.01; ***, p < 0.001 (two-tailed unpaired t test). Cell cycle stage was determined by nuclear morphology as revealed by Hoechst staining.
