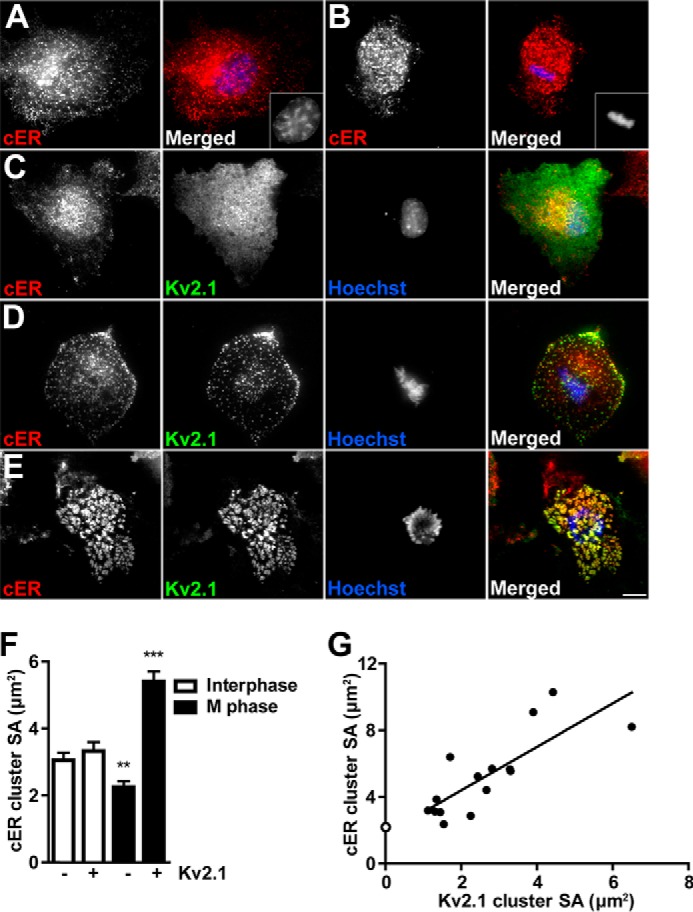
FIGURE 3.

M phase clustering of Kv2.1 recruits cER to PM:ER MCS. Control COS-1 cells in interphase (A) and M phase (B) expressing pDsRed2-ER (red) and stained with Hoechst nuclear dye (blue). Insets show nuclei. Kv2.1 expressing COS-1 cells in interphase (C) and M phase (D and E) expressing pDsRed2-ER (red) and GFP-Kv2.1 (green) stained with Hoechst nuclear dye (blue). Red and green images were acquired with TIRF microscopy, blue images were acquired with widefield fluorescence microscopy. Scale bar, 10 μm. F, average cER surface area (SA) was measured in M phase (black bars) and interphase (white bars) cells in the presence or absence of Kv2.1 (indicated below). Data are from an n of at least 180 clusters from at least 5 different cells in three independent samples. Data are the mean ± S.E. **, p < 0.01; ***, p < 0.001 (two-tailed unpaired t test). G, average cER cluster SA was plotted against the average Kv2.1 cluster SA. Filled circles are average surface areas per cell. Linear regression analysis was performed, r2 = 0.6326. Open circle is average cER cluster size from M phase cell lacking Kv2.1 from F.
