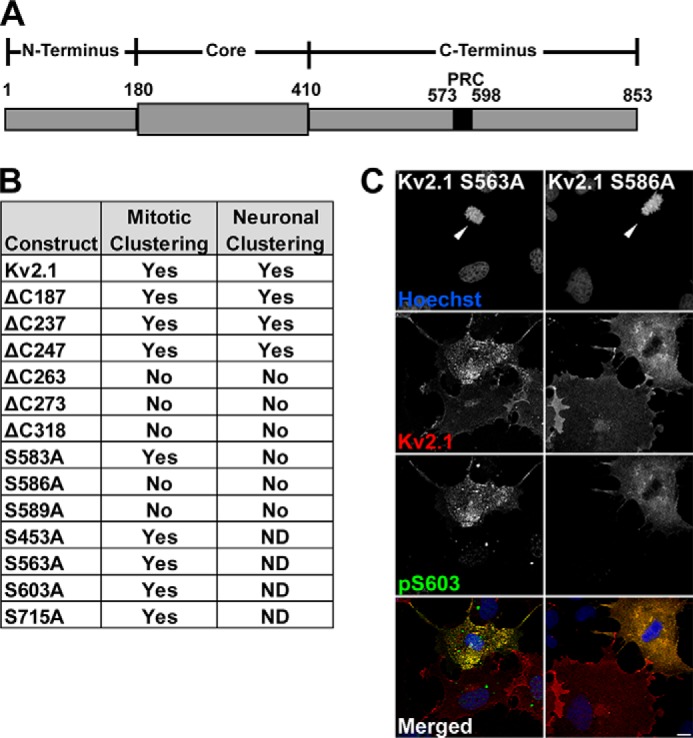
FIGURE 4.

Determinants of M phase clustering of Kv2.1. A, schematic diagram of Kv2.1, indicating the location of the PRC domain within the C terminus. B, comparison of Kv2.1 clustering in M phase COS-1 cells and neurons (neuron results from Ref. 9). C, COS-1 cells expressing mutant Kv2.1 constructs S563A, left, and S586A, right, stained with Hoechst (blue) and immunolabeled for total Kv2.1 (red), and Ser(P)-603 (green). Arrowheads indicate M phase nuclei. Scale bar, 10 μm.
