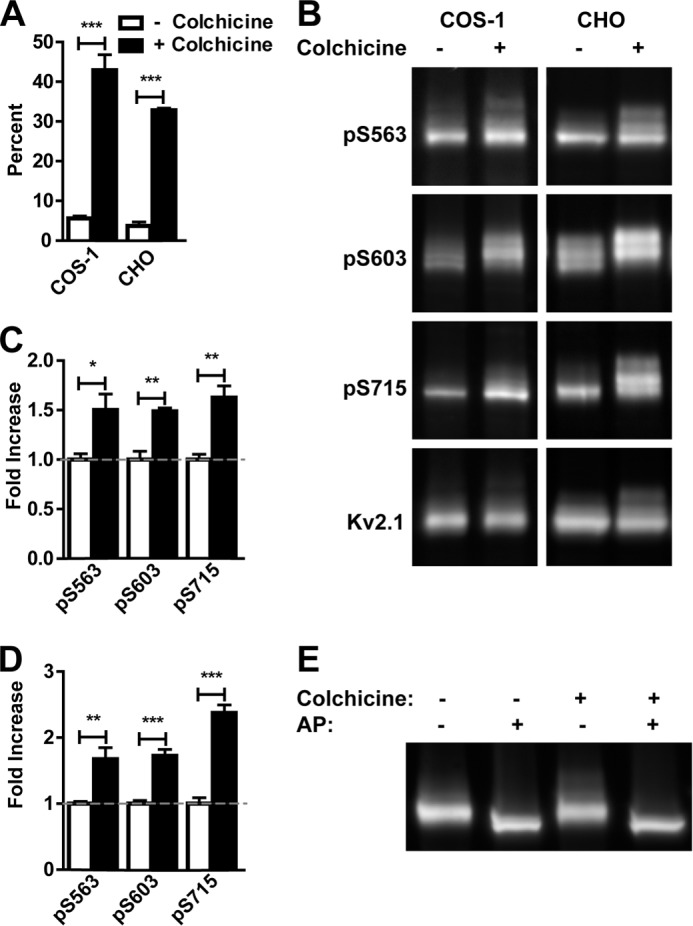
FIGURE 5.

M phase arrest leads to enhanced Kv2.1 phosphorylation. A, percent of H3pS10 positive nuclei in control (white bars) or colchicine-treated (black bars) COS-1 and CHO cells. B, lysates of Kv2.1 expressing COS-1 and CHO cells treated with or without colchicine probed for the indicated Kv2.1 phosphosites and total Kv2.1. The ratio of the intensity of each Kv2.1 phosphosite to total Kv2.1 was measured in control (white bars) and colchicine-treated (black bars) COS-1 (C) and CHO (D) cell lysates. Values are normalized to control lysates. Data are the mean ± S.E. *, p < 0.05; **, p < 0.01; ***, p < 0.001 (two-tailed unpaired t test). E, COS-1 cells were treated with or without colchicine, then lysates were incubated with or without alkaline phosphatase (AP).
