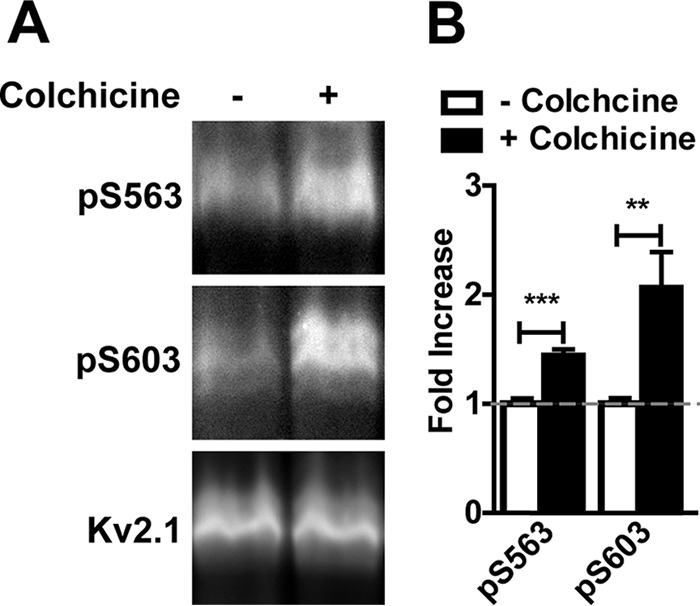
FIGURE 6.

Enhanced phosphorylation of endogenous Kv2.1 in a pancreatic β cell line. A, membrane fractions of INS1 cells treated with or without colchicine probed with the indicated Kv2.1 phosphospecific antibodies and total Kv2.1. B, the ratio of the intensity of each Kv2.1 phosphosite to total Kv2.1 was measured in control (white bars) and colchicine-treated (black bars) INS1 cells. Values are normalized to control cells. Data are the mean ± S.E. **, p < 0.01; ***, p < 0.001 (two-tailed unpaired t test).
