FIGURE 7.
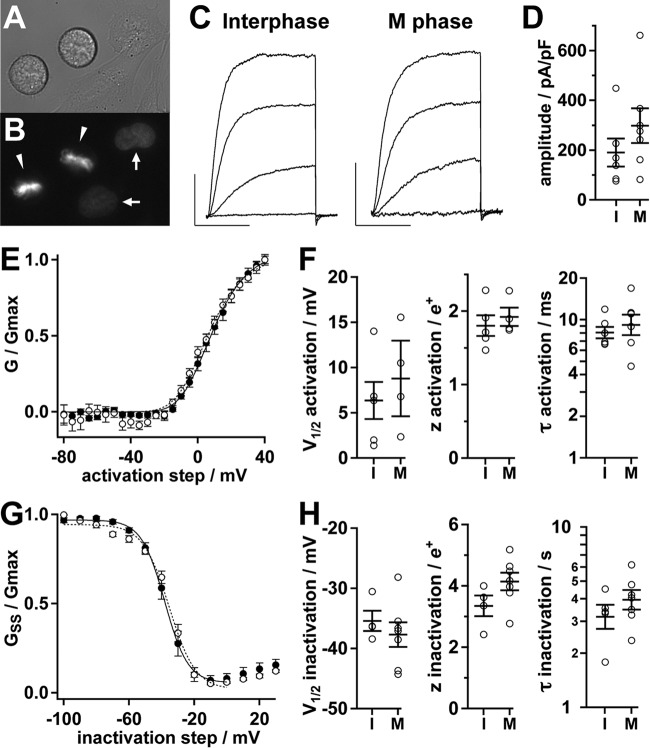
Electrophysiological characterization of Kv2.1. A, differential interference contrast image of live Kv2.1-expressing CHO cells plated for electrophysiology. B, Hoechst fluorescence from cells in A. Arrowheads indicate M phase nuclei, arrows indicate interphase nuclei. C, Kv2.1 activation in an interphase (left) or M phase cell (right). Representative whole cell currents in response to 100-ms steps to −20, 0, 20, and 40 mV were from a holding potential of −100 mV. Scale bars: 1 nA, 50 ms. D, amplitude of Kv2.1 currents at +40 mV from interphase (I) or M phase (M) cells. Circles are measurements from individual cells. Bars throughout the figure are mean ± S.E. E, mean conductance-voltage profile of Kv2.1 during M phase (solid circles, n = 4) or interphase (hollow circles, n = 5). Lines are fits of a fourth-power Boltzmann function. Parameters from fits ± S.D.: interphase (dotted line), Vmid = 7 ± 2 mV, z = 1.9 ± 0.2 e+; M phase (solid line), Vmid = 9 ± 1 mV, z = 1.9 ± 0.1 e+. F, individual cell parameters from fits to conductance (left and center) or activation kinetics at +40 mV (right). G, mean steady state inactivation-voltage profile during M phase (solid circles, n = 7) or interphase (hollow circles, n = 4). Lines are fits of a Boltzmann function. Parameters from fits ± S.D.: interphase (dotted line), Vmid = −35 ± 1 mV, z = 3.2 ± 0.5 e+; M phase (solid line), Vmid = −38.1 ± 0.5 mV, z = 3.6 ± 0.2 e+. H, individual cell parameters from fits to steady-state conductance (left and center) or inactivation kinetics at 0 mV (right).

