FIGURE 1.
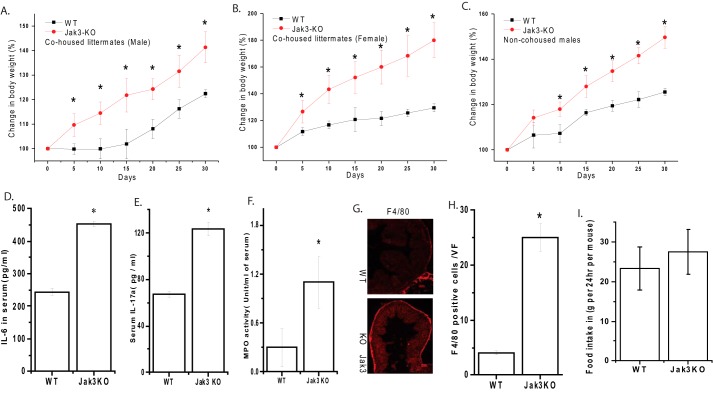
Loss of Jak3 leads to increased body weight and systemic chronic low-grade inflammation: A–B, jak3−/− mice were back-crossed to C57BL/6 jak3+/+ to generate jak3−/+ mice, which were then in-bred to generate jak3−/− and jak3+/+ littermates. Body weight of co-housed Jak3-KO and their WT siblings male (A) or female (B) or non-co-housed males Jak3-KO and WT (C) were plotted at the indicated intervals as a percentage of their body weight at the time of weaning. D–E, increased pro-inflammatory cytokines IL-6 and IL17a in serum of KO mice: cytokine level in the blood serum from WT and KO mice were measured using a mouse Multianylate cytokine assay kit (Qiagen) per the manufacturer's protocol, and mean values from each group (n = 6 mice per group) are shown. F, MPO in serum of WT and KO mice: MPO activity was determined as described in “Experimental Procedures” and plotted as mean values from each group (n = 6 mice per group). G–H, loss of Jak3 leads to increased colonic macrophages in mice: Colonic tissue sections from WT and Jak3-KO mouse were immunostained for macrophages using F4/80 antibody (G). Images were acquired using Nikon C1-plus laser confocal microscope and representative images are shown from each group (n = 6). Scale bar 100 μm. The number of macrophages in five visual fields (VF) chosen at random were counted for each animal at 200× magnification and the results are quantified as the average number of macrophage positive cells per visual field (H). I, modest increase in average food intake by the Jak3-KO mice. Age and sex matched WT or Jak3-KO mice were transferred to new cage (n = 5 mice per cage) with known amount of diet. After 24 h, food was reweighed and the amounts consumed were calculated by difference. Average (n = 10 cages per group) weight of food consumed per cage was plotted verses each group. A–F, H, values are mean ± S.E. Asterisks (*) indicate statistically significant differences between WT and KO groups (p < 0.05, n = three independent experiments). G, representative images are from n = 3 images from n = 6 mice per group.

