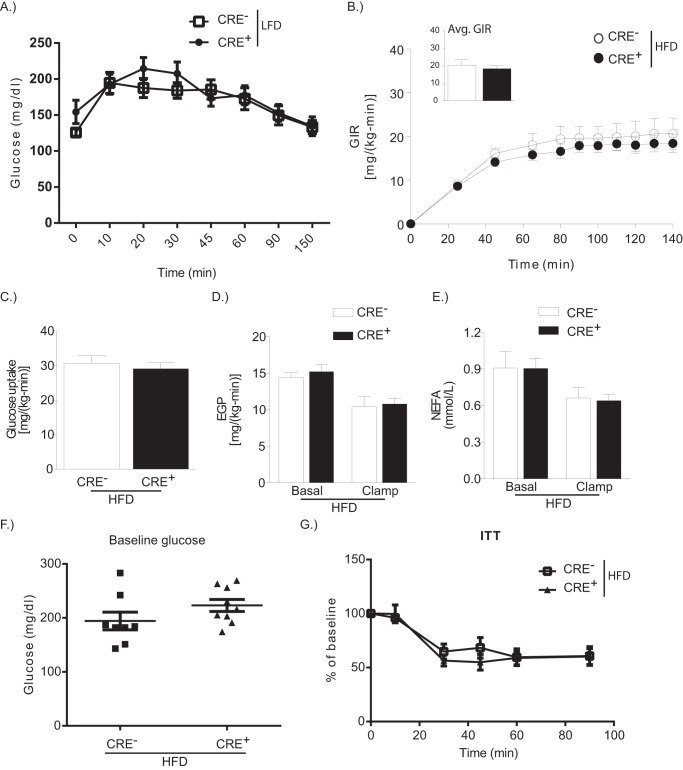
FIGURE 6.
Macrophage-specific Sptlc2 is not required for diet-induced insulin resistance. A, glucose tolerance test on LFD-fed CRE− or CRE+ mice. B, glucose infusion rates (GIR) during hyperinsulinemic-euglycemic clamps in CRE− or CRE+ mice on HFD for 12 weeks. The inset shows the average glucose infusion rate (Avg. GIR). C, whole body glucose uptake. D, endogenous glucose production (EGP) at basal and after clamp. E, nonesterified fatty acid level in the blood at basal and after clamp (n = 4 CRE−; n = 7 CRE+). F and G, baseline glucose levels after a 4-h fast (F) and at time points after intraperitoneal injection of insulin (G) (insulin tolerance test, ITT) in CRE− or CRE+ mice on HFD (n = 8; t test). *, p < 0.05. The error bars represent means ± S.E.

