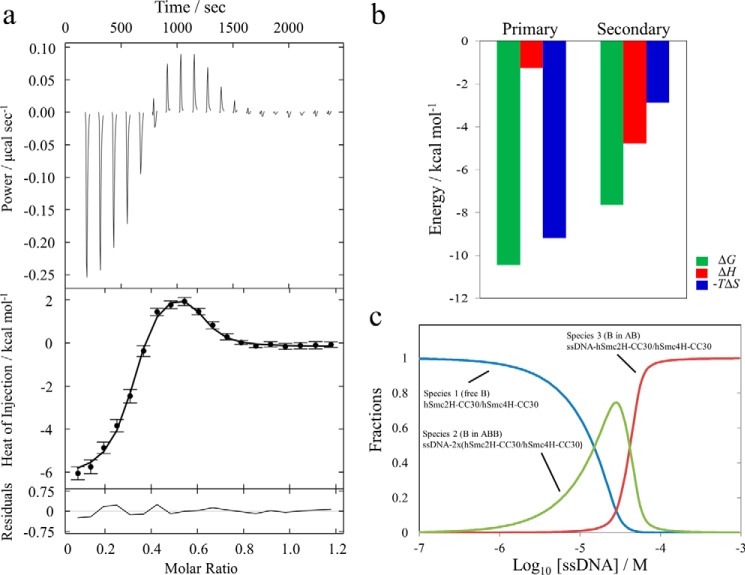
FIGURE 5.
Interaction analysis of hSmc2H-CC30/hSmc4H-CC30 with ssDNA observed by ITC. a, the representative titration profile of the triplicate experiments is shown. The thermogram of the titration of the ssDNA into hSmc2H-CC30/hSmc4H-CC30 is shown in the top panel. The normalized binding enthalpy data (black circles) with error bars provided by NITPIC are shown in the middle panel. The line in this panel represents the fitting result with the best parameters obtained from the global analysis based on A + B + B ⇄ AB + B ⇄ ABB interacting model, where A is ssDNA, and B is the heterodimer. The residuals are shown in the bottom panel. b, thermodynamic parameters obtained by nonlinear fitting of the thermogram using A + B + B ⇄ AB + B ⇄ ABB interacting model. c, dependences of fractions for the three species (B, AB, and ABB) on ssDNA (total A) concentration using the fitted thermodynamic parameters (primary Kd = 22.3 nm; secondary Kd = 2.5 μm) at the initial concentration of the heterodimer, 54 μm.

