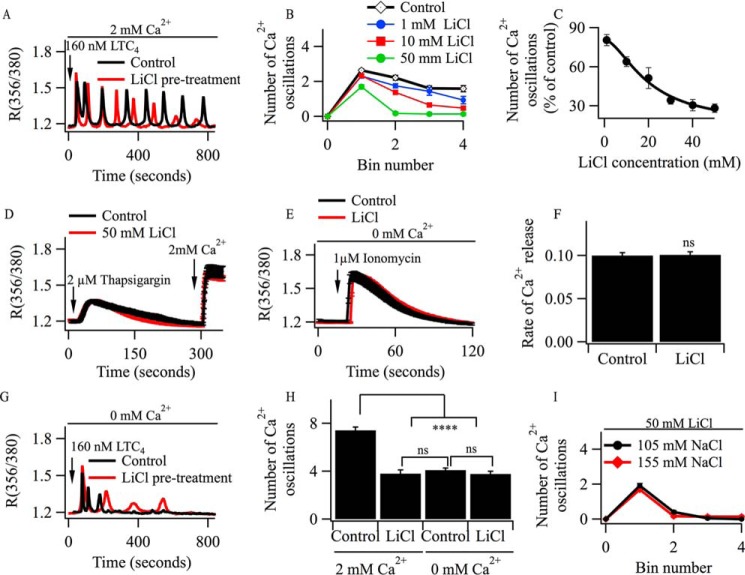
FIGURE 2.
Li+ blocks agonist-mediated oscillations in [Ca2+]i. A, cytoplasmic Ca2+ oscillations evoked by 160 nm LTC4 are compared between a control cell and one pre-exposed to 10 mm LiCl for ∼90 min. B, graph comparing cytoplasmic Ca2+ oscillations evoked by LTC4 between control cells and cells exposed to different concentrations of LiCl prior to stimulation. C, graph plotting the number of cytoplasmic Ca2+ oscillations evoked by LTC4 over 800 s of stimulation in the presence of different LiCl concentrations. The number of oscillations is normalized to the number of oscillations observed in control cells. Values were fitted with a Hill-type equation, yielding an IC50 value of 15 mm. D, thapsigargin-evoked Ca2+ release and Ca2+ influx are compared between control cells and cells pre-exposed to 50 mm LiCl for 90 min. Error bars (mean ± S.E.) are within the symbols. E, comparison of ionomycin-induced Ca2+ release in control cells and cells pretreated with 15 mm of LiCl for 90 min. F, data from three independent experiments as in E. ns, not significant. G, cytoplasmic Ca2+ oscillations in Ca2+-free external solution following stimulation with 160 nm LTC4 are compared between a control cell and one pretreated with 15 mm LiCl for 90 min. H, aggregate data from three experiments measuring the total number of cytoplasmic Ca2+ oscillations over an 800-s stimulation period with LTC4 are compared. Cells were stimulated either in the presence or absence of external Ca2+. The LiCl groups refer to pretreatment with 15 mm LiCl for 90 min. The data represent >52 cells from four independent experiments for each condition. ****, p < 0.0001. I, aggregate data showing the number of cytoplasmic Ca2+ oscillations evoked by LTC4 in 50 mm LiCl in an external solution containing either 155 or 105 mm NaCl, both with 2 mm Ca2+. Each bin number represents a period of 200 s. Each data point is >25 cells.

