FIGURE 5.
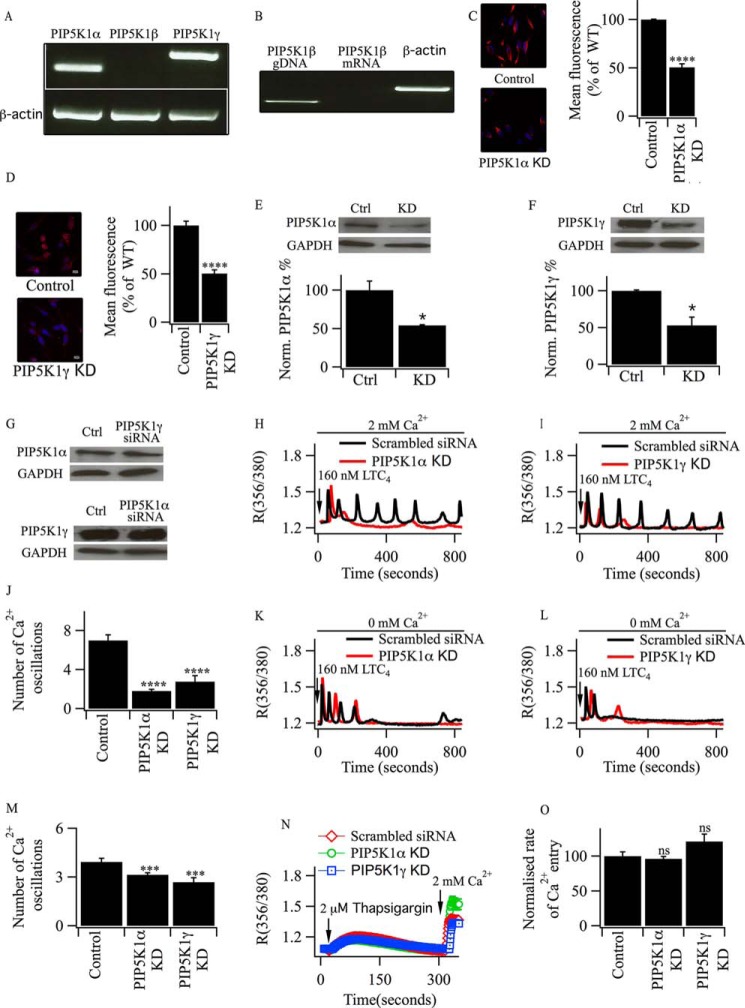
PIP5K1 isoforms are involved in maintaining LTC4-driven cytoplasmic Ca2+ oscillations. A, RT-PCR comparing the expression of PIP5K1 isoforms in RBL-2H3 cells. B, PIP5KIβ mRNA is absent from RBL-2H3 cells despite genomic DNA (gDNA) being detectable. C and D, confocal microscopy images comparing the expression of PIPK1α and γ protein between control cells and those in which either PIP5K1α (C) or PIP5K1γ (D) had been knocked down (KD). The corresponding histograms summarize data from >40 cells in each group. ****, p < 0.0001. E, Western blot comparing the expression of PIP5K1α in control (Ctrl) cells and after siRNA-directed knockdown. *, p < 0.05. F, Western blot comparing the expression of PIP5K1γ in control cells and after siRNA-directed knockdown. *, p < 0.05. G, Western blot comparing the expression of PIP5K1α after knockdown of PIP5Kγ (top panel) and vice versa (bottom panel). H and I, cytoplasmic Ca2+ oscillations evoked by LTC4 run down quickly after knockdown of PIP5K1α (H) or PIP5K1γ (I). Scrambled siRNA controls are included. J, histogram comparing the total number of cytoplasmic Ca2+ oscillations evoked by LTC4 in 2 mm external Ca2+ over 800 s of stimulation from three independent experiments. ****, p < 0.0001. K and L, the effect of knockdown of PIP5K1α (K) or PIP5K1γ (L) on responses evoked by LTC4 in Ca2+-free solution. M, histogram comparing the average number of Ca2+ oscillations in Ca2+-free solution for the conditions shown. ***, p < 0.001. N, Ca2+ release and Ca2+ influx evoked by thapsigargin are compared following knockdown of PIP5K1α and PIP5K1γ or after transfection with scrambled siRNA. O, the rates of Ca2+ entry following stimulation with thapsigargin as in K are compared for the conditions shown. ns, not significant.

