FIGURE 7.
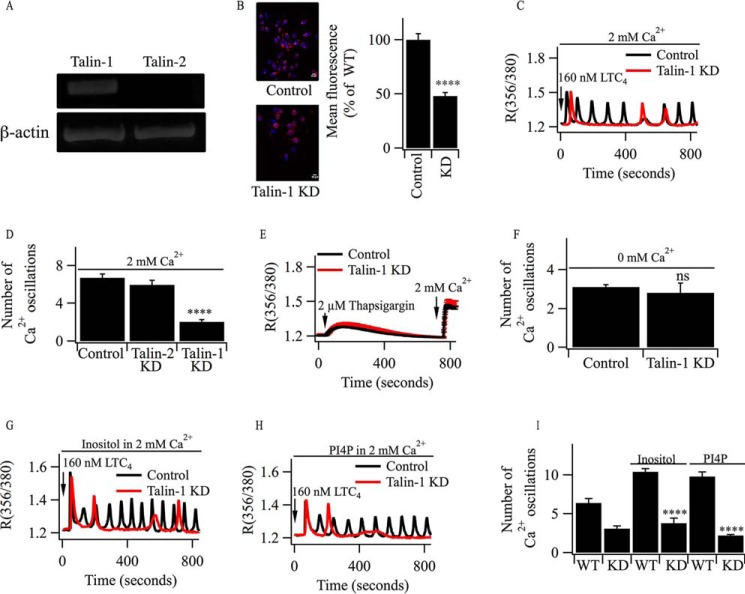
Knockdown of talin1 accelerates the rundown of oscillations in [Ca2+]i evoked by LTC4. A, RT-PCR reveals the presence of talin1 but not talin2 in RBL-2H3 cells. B, immunocytochemical detection of talin1 in control cells and after knockdown (KD). The histogram summarizes data from between 40 and 52 cells for each condition. ****, p < 0.0001. C, cytoplasmic Ca2+ oscillations evoked by LTC4 run down more quickly after talin1 knockdown. D, aggregate data from several experiments are summarized. Each column represents data from between 24 and 32 cells. E, thapsigargin-evoked cytoplasmic Ca2+ signals are unaffected by talin1 knockdown. F, the total number of cytoplasmic Ca2+ oscillations evoked by LTC4 in Ca2+-free solution are similar in control cells and those in which talin1 had been knocked down. ns, not significant. G, oscillations in [Ca2+]i evoked by LTC4 in talin1-deficient cells are not rescued by addition of inositol. Control refers to a wild-type cell stimulated with LTC4 in the presence of inositol. H, PI4P fails to rescue cytoplasmic Ca2+ oscillations in cells following knockdown of talin1. I, aggregate data from several independent experiments are compared. ****, p < 0.0001 compared with the corresponding controls. LTC4 was used to stimulate the cells. KD, knockdown of talin1.

