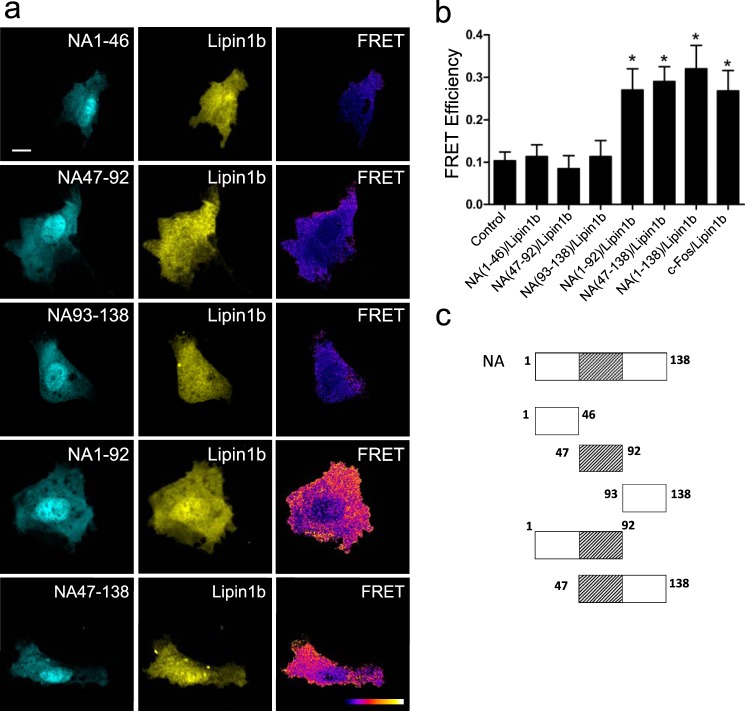
FIGURE 11.
FRET microscopy reveals the importance of c-Fos 47–93-aa region for lipin 1β association. a, FRET donor mTurquoise2 (left), FRET acceptor mSYFP2 (center), and FRET efficiency image (right). NIH 3T3 cells were transfected with the indicated plasmids, and images of representative cells co-expressing donor/acceptor pairs are displayed. FRET efficiency images were generated with ImageJ; the pixel value represents the FRET efficiency value in a black-to-white increasing scale as described in the legend to Fig. 8. b, mean FRET efficiency ± S.D. for the donor/acceptor pairs shown in a in ROIs located in the cytoplasm. Results obtained after the examination of 25 cells in each case, averaging 10–15 ROIs/cell, are from one representative experiment out of at least three performed. *, p < 0.001 as determined by one-way analysis of variance with Dunnett's post test. White bar on the upper left image corresponds to 10 μm. c, schematic representation of the NA mutants used in a. The high hydrophobicity region of aa 47–93 is highlighted using diagonal lines as it showed particular importance in the protein/protein association.

