FIGURE 4.
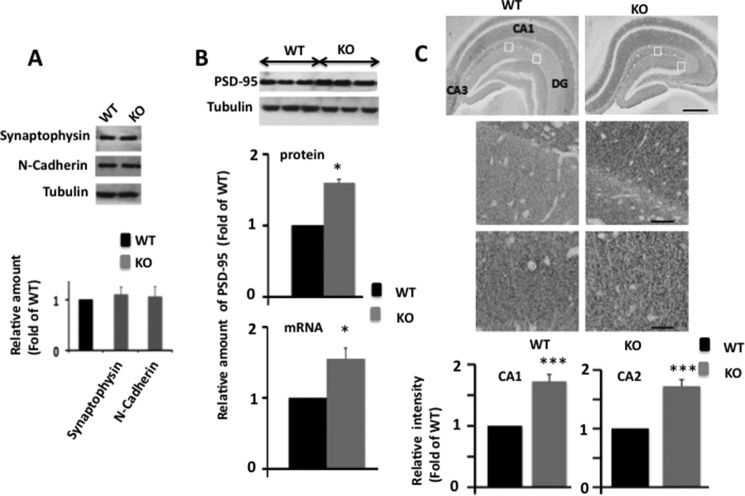
PSD-95 protein and mRNA levels are elevated in Egr-1 KO mouse hippocampi. Hippocampi of WT and KO mice (each 6 months old) were analyzed by Western blotting, qPCR, and immunohistochemistry. A, levels of synaptophysin and N-cadherin are not altered in Egr-1 KO mouse hippocampus. Hippocampal extracts of adult WT and Egr-1 KO mice (n = 3 in each group) were analyzed by quantitative Western blot analysis. Based on band intensities, relative amount of each protein was determined and compared. Upper panel is a representative Western blot. Lower panel indicates quantification data from three animals in each group. B, quantitative Western blot and qPCR analyses for PSD-95. Upper panel shows a representative Western blot. Middle panel is the result of Western blot quantification. Data presented are from three animals from each group. *, p < 0.05 (n = 3) with respect to WT. Lower panel shows quantitative RT-PCR analysis of PSD-95 mRNA (normalized to β-actin) in hippocampus of KO and WT genotypes (see Table 1 for primers used). The data are from three mice in each group. *, p < 0.04 with respect to WT. C, immunohistochemistry. Upper panel is a representative micrograph. Middle panels are corresponding insets at higher magnification. Immunohistochemical staining revealed widespread expression of PSD-95 in the hippocampal formation in both genotypes. Compared with WT, KO mice show higher PSD-95 immunostaining in CA1, CA2, and DG subfields. Scale bars, 100 μm in upper panel and 20 μm in middle panels. Lower panel shows analysis of PSD-95 immnoreactivity (optical density) in the CA1 and CA2 of hippocampus. Quantification of immunohistochemical staining was performed using the Spectrum Analysis algorithm package and ImageScope analysis software (version 11.2, Aperio Technologies). A rectangular region of interest, 25 μm2 in size, was defined. Immunoreactivity value for each region of interest was obtained. The immunoreactivity within each regions of interest in each section was averaged to generate a mean immunoreactive value for each animal. Data were averaged from three mice each with four regions (n = 12) for each genotype and are expressed as the fold of WT. ***, p < 0.001 (n = 3) with respect to WT.

