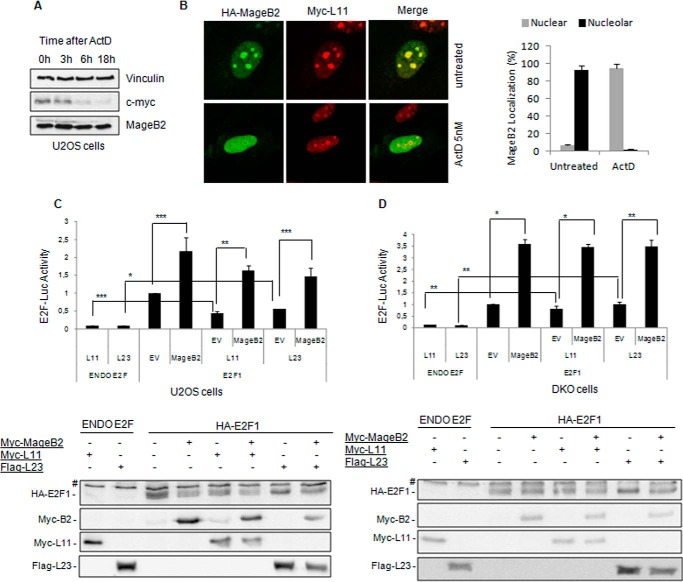
FIGURE 7.
MageB2 expression counteracts ribosomal protein-driven inhibition of E2F1. A, Western blot of a time course assay after addition of 5 nm Actinomycin D to U2OS cells. The membrane was probed with c-myc, MageB2, and Vinculin (loading control) antibodies. B, confocal microscopy images of HA-MageB2 and Myc-L11 constructs before (left panel, top row, untreated) and after (left panel, bottom row, Act-D, 5 nm) 3-h Actimomycin D treatment of U2OS cells. Right panel, the percentage of cells displaying MageB2 with nuclear or nucleolar localization before and after treatment with 5 nm Act-D. 200 cells in total were counted under each experimental condition. C, reporter gene assay for E2F activity using the 6×E2F-LUC reporter construct. The effect of MageB2 was assessed when co-transfected with Myc-L11 and FLAG-L23 ribosomal proteins constructs. ***, p < 0.05; **, p < 0.01; *, p < 0.005. The assay was performed in U2OS cells. A Western blot of the expressed proteins is shown below the histogram. EV, empty vector; #, nonspecific band. D, reporter gene assay for E2F activity using the 6×E2F-LUC reporter construct. The effect of MageB2 was assessed when cotransfected with Myc-L11 and FLAG-L23 ribosomal proteins constructs. **, p < 0.05; *, p < 0.005. The assay was performed in double knockout (p53−/−; Mdm2−/−) mouse embryonic fibroblasts (DKO cells). A Western blot of the expressed proteins is shown below the histogram. Error bars indicate mean ± S.D. Student's t test was used for statistical analysis.

