FIGURE 13.
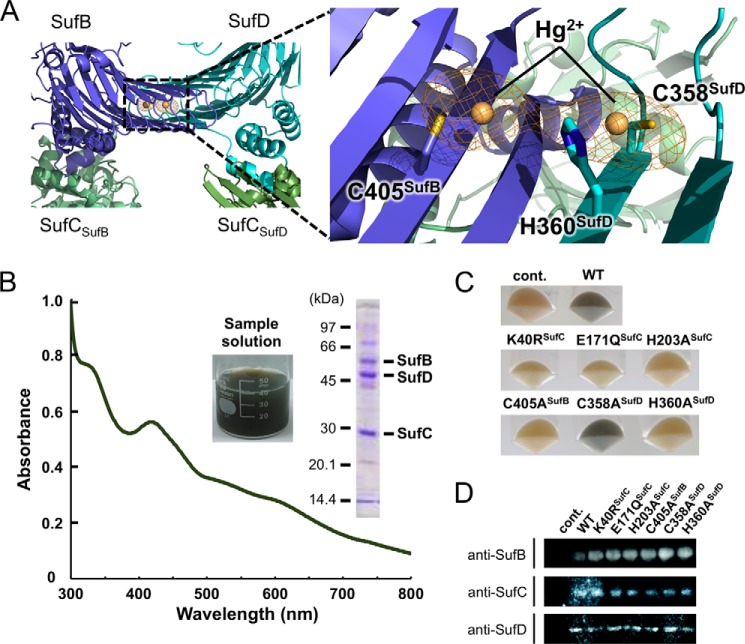
In vivo Fe-S cluster formation on the SufBCD complex. A, anomalous difference map for Hg2+ ion (contoured at 6.0 σ) in the Hg derivative of the SufBCD complex. A square highlights the binding site of Hg2+, of which the right panel shows a close-up view. Two Hg2+ ions bound to Cys-405 in SufB and Cys-358 in SufD are adjacent to His-360. These residues are depicted with a stick model, and Hg2+ ions are shown as orange balls. B, UV-visible absorption spectrum of the SufBCD complex at an early purification stage. The inset shows the sample solution and SDS-PAGE analysis of the partially purified SufBCD complex used in this measurement. C, colors of the harvested host cells overproducing the SufBCD complex and its variants. The blackish-green color represents the in vivo Fe-S cluster formation on the SufBCD complex. D, comparison of the expression level of SuB/SufC/SufD among the cells harboring the wild-type plasmid or the various mutant plasmids by immunoblot analyses using antibodies against SufB, SufC, and SufD. cont., control.

