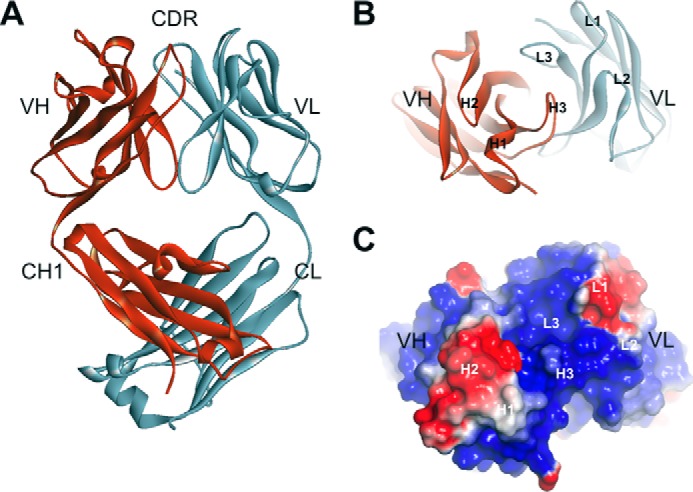
FIGURE 1.

Ribbon diagram of the crystal structure of ch8H9 Fab. A, side view of Fab showing individual Ig domains and CDR. B, top down view on antigen binding site showing the orientation of the 6 CDR loops. C, electrostatic surface potential of antigen binding site rendered from negatively charged (red) to positively charged (blue) in a range from −1 to +1 kT/e.
