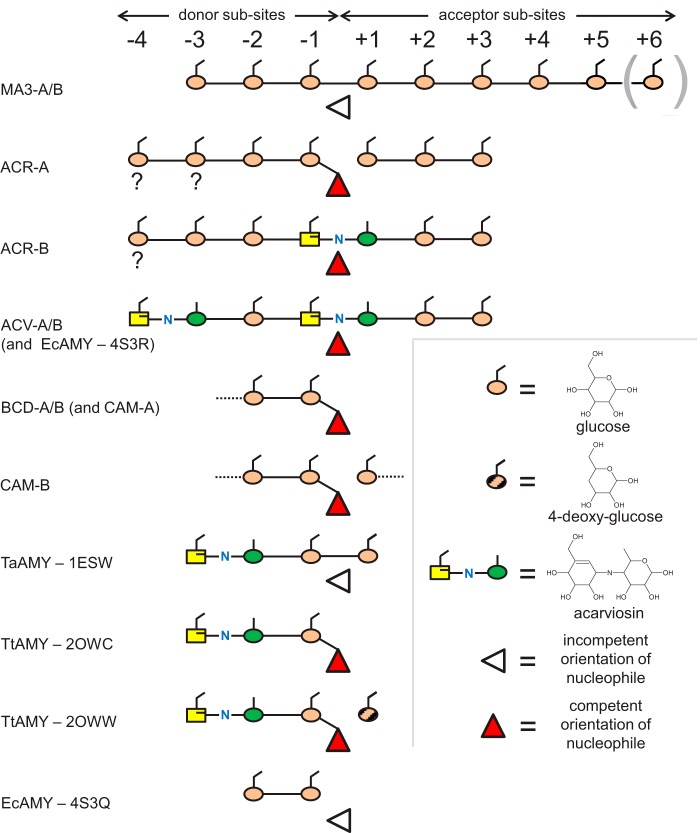
FIGURE 6.
Schematic representations of the ligand-bound complexes of AtDPE1. For each different binding mode, the occupancy of the various subsites is indicated. The triangles indicate the status of the active site nucleophiles. For MA3-A, density was present for a residue in the +6 site, but not for MA3-B; otherwise, the bound ligands were very similar. For ACR-A and ACR-B, the identities of several of the sugar residues were uncertain (indicated by the question marks below these residues), and a non-glucose sugar was only inserted when there was compelling evidence for it. Also shown for comparison are the relevant ligand-bound complexes of the amylomaltases.

