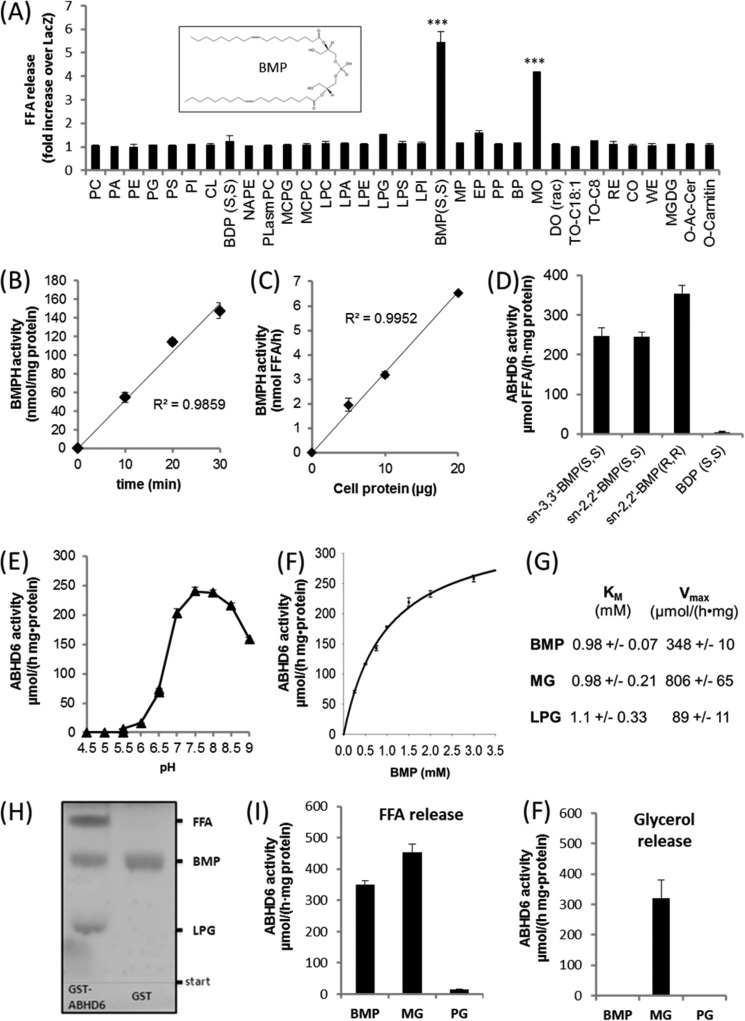
FIGURE 1.
Substrate selectivity and pH dependence of ABHD6. A, the coding sequence of mouse ABHD6 was cloned into a mammalian expression vector (pcDNA4/HisMaxC) and overexpressed in COS-7 cells. Cell lysates (1000 × g supernatant) containing recombinant ABHD6 were incubated with various polar and neutral lipids. Lipid degradation was monitored by measuring the release of FFA. Cells expressing β-galactosidase (LacZ) were used as a negative control. Data are expressed as -fold increase in FFA release over LacZ. For more information about lipids, see “Experimental Procedures.” Inset, sn-2,2′-dioleoyl BMP. B and C, time- (B) and dose-dependent (C) hydrolysis of BMP by Cos-7 lysates overexpressing ABHD6. The activity detected in cells expressing LacZ was set as blank. D, degradation of sn-3,3′-BMP(S,S), sn-2,2′-BMP(S,S), sn-3,3′-BMP (R,R), and bis(diacylglycero)phosphate(S,S) by purified GST-tagged ABHD6. E, pH dependence of purified GST-ABHD6 using BMP(S,S) as substrate. Activity assays were performed in 50 mm acetate (pH 4.5–5.5), MES (pH 5.5–6.5), and bis-tris propane buffer (pH 6.5–9.0). F, substrate saturation kinetics of purified GST-ABHD6 using BMP(S,S) as substrate. G, Km and Vmax values using BMP(S,S), racemic MO, and LPG as substrate. Values were calculated by nonlinear regression analysis (SigmaPlot). H, TLC analysis showing that partial digestion of BMP with GST-ABHD6 results in the accumulation of LPG and FFA. After digestion, lipids were isolated by butanolic extraction and applied to TLC analysis using chloroform/methanol/water (60/25/4, v/v/v) as solvent. GST purified under identical conditions served as a negative control. I and F, FFA (I) and glycerol (F) release using BMP(S,S), racemic MO, or PG as substrate for GST-ABHD6. FFA and glycerol release were quantified using commercially available kits. Data are presented as mean ± S.D. (***, p < 0.001, Student's t test).

