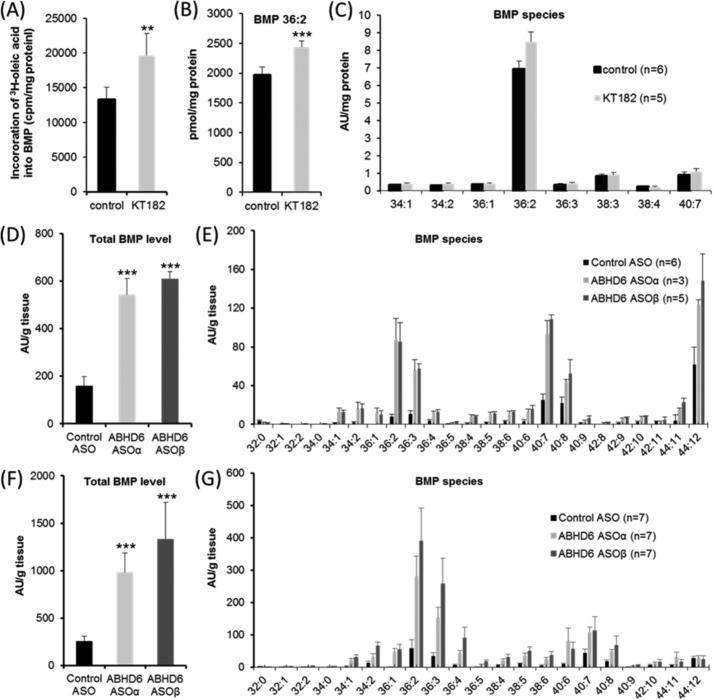
FIGURE 4.
ABHD6 affects BMP catabolism. A, incorporation of 3H-labeled oleic acid into BMP of AML12 hepatocytes. Cells were cultivated for 24 h in DMEM/F-12 (1:1) containing 1% FCS. Subsequently, cells were exposed to DMEM/F-12 (1:1) containing 20% FCS and 3H-labeled oleic acid for 4 h either in the absence or presence of KT182. Inhibitor or carrier (dimethyl sulfoxide) was added 1 h before exposure to DMEM/F-12 (1:1) containing 20% FCS/[3H]oleic acid. Total lipids were extracted and separated by TLC analysis. The radioactivity co-migrating with BMP was determined by scintillation counting. B and C, effect of KT182 on BMP level and distribution in AML12 cells. Cells were cultivated under identical conditions as described in A but in the absence of 3H-labeled oleic acid. Total lipids were extracted in the presence of BMP 14:0 as internal standard and subjected to LC-MS analysis. For quantification of BMP 36:2 (B), a calibration curve was prepared. Other molecular species are shown in arbitrary units (AU)/mg of protein. D–G, liver BMP levels of male C57BL/6N mice treated with ASOs targeting ABHD6 (ASOα and ASOβ) or control ASO. Mice were maintained for 12 weeks on a normal chow diet or on a high-fat diet and injected biweekly with ASOs (25 mg/kg of body weight) as described previously (14). Subsequently, lipids were extracted from liver samples in the presence of BMP 14:0 (Avanti Polar Lipids) as internal standard and subjected to LC-MS analysis. D and E, relative total BMP levels (D) and BMP distribution (E) of mice maintained on a chow diet. F and G, relative total BMP levels (F) and BMP distribution (G) of mice maintained on a high-fat diet. The experiments shown in A–C are representative of two independent experiments performed in triplicate. Data are presented as mean ± S.D. *, p < 0.05; **, p < 0.01; ***, p < 0.001; analysis of variance).

