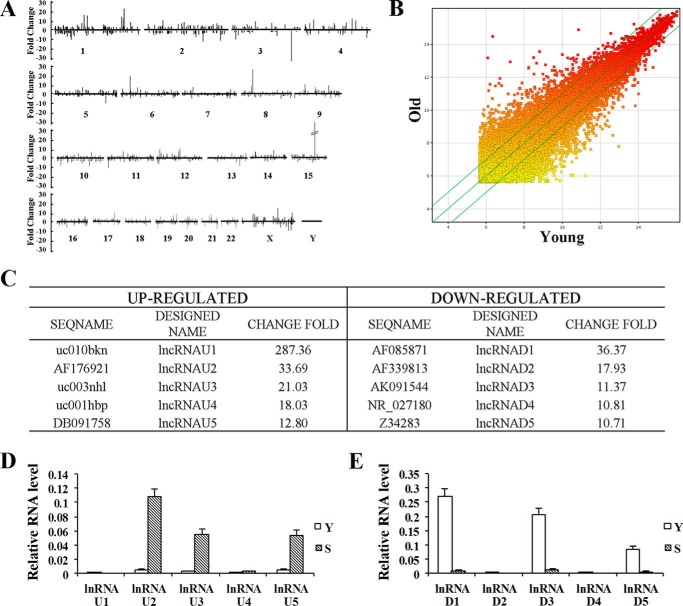
FIGURE 1.
Genome-wide screening of senescence-related lncRNAs and validation. A, lncRNA microarrays identified 1,867 senescence-related lncRNAs comparing senescent and young 2BS fibroblasts. The threshold was set as 2.5-fold changes. Numbers 1–22 and X and Y represent chromosome number. B, a scatter plot is used for assessing lncRNA expression variation. The values of the x and y axes in the scatter plot are the averaged normalized signal values of groups of samples (log2-scaled). C, the five most significantly up-regulated (designated as lncRNAU1 to -U5) or down-regulated (designated as lncRNAD1 to -D5) lncRNAs listed according to lncRNA microarrays. D, qRT-PCR analysis of lncRNAU1 to -U5 expression in young (Y) and replicative senescent (S) 2BS cells. E, qRT-PCR analysis of lncRNAD1 to -D5 expression in young (Y) and replicative senescent (S) 2BS cells. Levels are normalized to GAPDH expression and are represented as means ± S.D. (error bars) unless otherwise indicated.

