FIGURE 2.
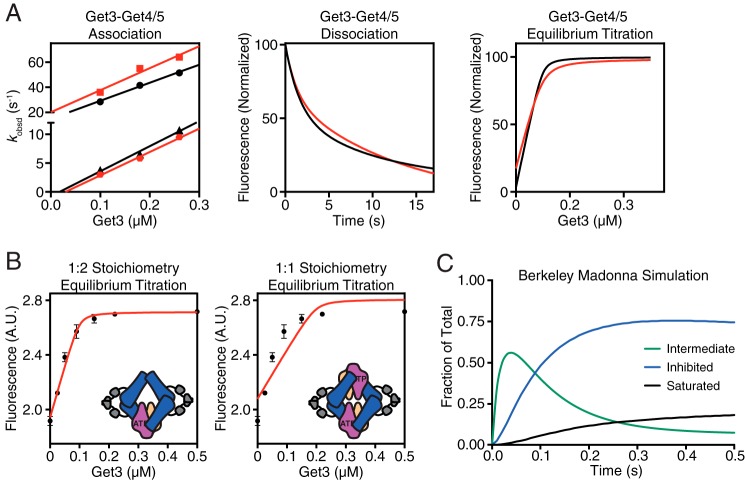
Modeling of experimental kinetic data. A, comparison of experimental (black) and simulated (red) binding data for the Get3·Get4/5 complex. Association rate measurements (left), dissociation rate measurements (center), and equilibrium titrations (right) are shown. B, left, model depicting a 1:2 binding stoichiometry of Get3 with Get4/5. This configuration was used to fit an equilibrium titration of acrylodan-labeled Get4/5 full length (100 nm) with Get3 in 2 mm ATP. Right, same as on left but fit with a model assuming a 1:1 binding stoichiometry. Error bars represent S.D. C, Berkeley Madonna simulation of the time course of Get3·Get4/5 complex formation. A.U., absorbance units.

