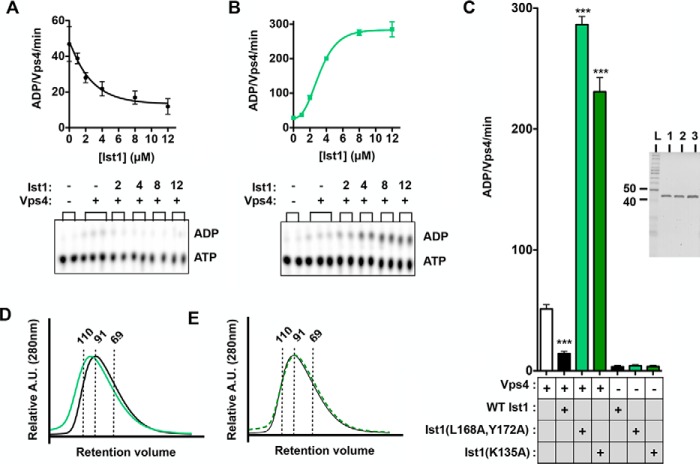
FIGURE 2.
Ist1(L168A,Y172A) and Ist1(K135A) hyperstimulate Vps4 ATPase activity. A and B, ATPase activities for titrations of 500 nm-12 μm WT Ist1 (A) or Ist1(L168A,Y172A) (B) in the presence of 500 nm Vps4. Vps4-specific activity is expressed as ADP generated per Vps4 molecule per minute. Raw data of TLC plates for a single time point (16′) are shown, which were used to calculate Vps4-specific activities. C, ATPase activities of Ist1(L168A,Y172A) and Ist1(K135A) alone or in the presence of 500 nm Vps4. Results are presented as mean + S.D. of triplicate experiments, with statistical differences from 500 nm Vps4 alone indicated (***, p < 0.001). The purity of recombinant Ist1 proteins as assessed by SDS-PAGE analysis and Coomassie staining is shown in the right panel (L, ladder; lane 1, WT Ist1; lane 2, Ist1(L168A,Y172A); lane 3, Ist1(K135A)). D and E, UV traces for SEC analyses of Ist1. D, WT Ist1 (black) and Ist1(L168A,Y172A) (green). E, WT Ist1 (black) versus Ist1(K135A) (dashed green). A.U., absorption units. Apparent molecular weights are indicated by dashed lines.

