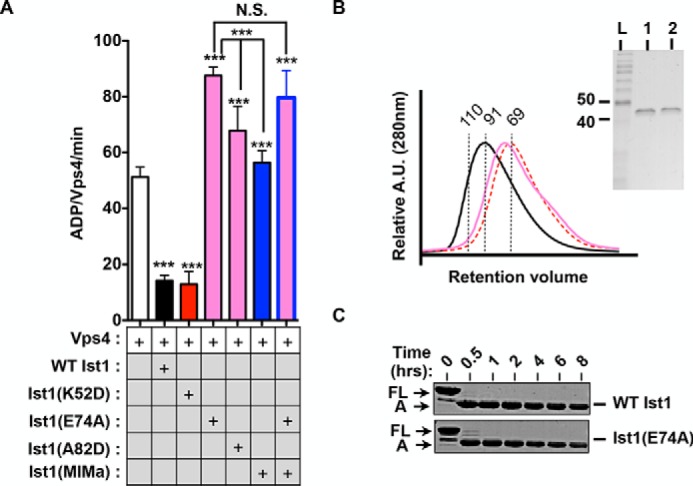
FIGURE 8.

Mutations in the Ist1 ELYC region result in loss of Vps4 inhibition. A, ATPase activities of 500 nm Vps4 in the presence of 8 μm Ist1 ELYC regions with or without MIM mutants. Results are presented as mean + S.D. of triplicate experiments, with statistical differences from 500 nm Vps4 alone indicated (***, p < 0.001; N.S., not significant). B, UV traces for SEC analyses of WT Ist1 (black), Ist1(E74A) (pink), and Ist1(K52D) (red, dashed). A.U., absorption units. The purity of recombinant Ist1 proteins as assessed by SDS-PAGE analysis and Coomassie staining is shown in the right panel. Lane 1, Ist1(E74A); lane 2, Ist1(A82D). L, ladder. C, limited proteolysis of Ist1 with trypsin. Aliquots were removed at various time points for SDS-PAGE analysis and Coomassie staining. Full-length (FL) Ist1 and the A fragments are indicated.
