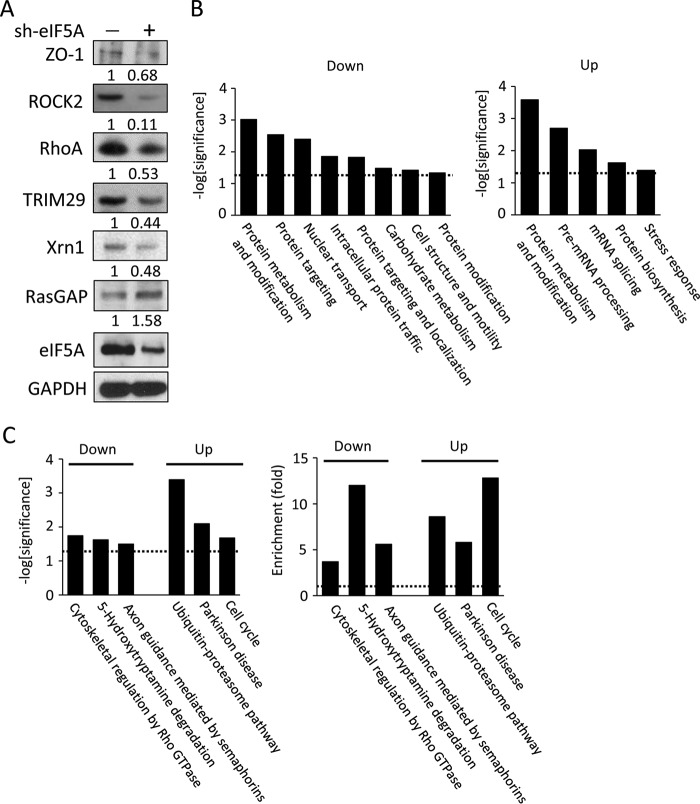
FIGURE 3.
Validation and bioinformatic analyses of proteins down- or up-regulated by eIF5A knockdown. A, validation of proteomic profiling by Western blots. Cell lysates from 779E cells expressing control- or eIF5A-shRNA were probed for the indicated proteins. GAPDH served as a loading control, and mean relative signal intensities for the probed proteins relative to GAPDH are shown below the blots (n = 3). B, functional classification of proteins down- (left) or up-regulated (right) by eIF5A knockdown based on gene ontology (GO) analysis. Dotted lines represent significance threshold. C, functional classification of proteins down- (left) or up-regulated (right) by eIF5A knockdown based on biological pathway analysis. Left panel shows statistical significance, whereas the right panel shows enrichment. Dotted lines represent significance threshold.

