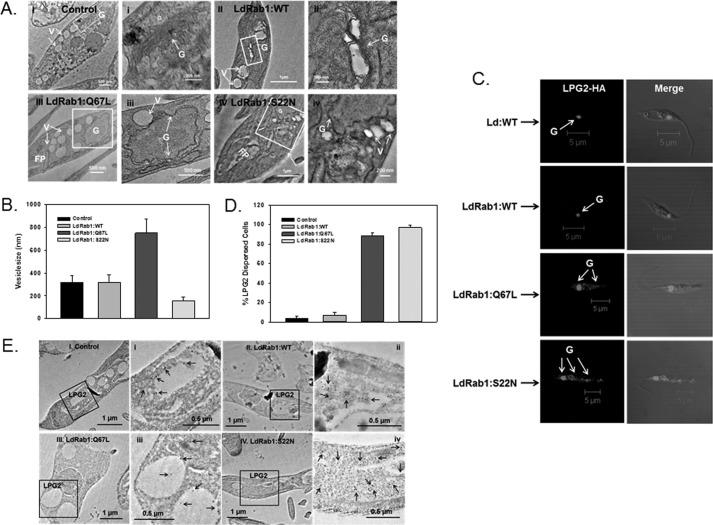
FIGURE 5.
Morphology of Golgi in Leishmania expressing GFP-LdRab1 or its mutants. A, transmission electron micrographs showing the ultrastructural morphology of Golgi. I, untransfected control cells; II, GFP-LdRab1:WT-overexpressing cells; III, GFP-LdRab1:Q67L-overexpressing cells; IV, Rab1:S22N-overexpressing cells. i, ii, iii, and iv, high magnification images of the Golgi region of the indicated cells. Images are representative of several independent observations. G, Golgi; FP, flagellar pocket; V, vesicles. B, quantitative analysis of several electron micrographs (n = 50) showing the size of the transport vesicles in the indicated cell types. Results are expressed as mean ± S.D. (error bars). C, distribution of the Golgi marker protein, LPG2, in Leishmania expressing LdRab1 and its mutants. LdRab1 and its mutant overexpressed cells were co-expressed with LPG2-HA as described under “Experimental Procedures.” Cells were stained with anti-HA antibody followed by secondary antibody labeling with Alexa546 and analyzed by confocal microscopy. Results are representative of three independent preparations. D, quantitative analysis of the percentage of cells showing dispersed distribution of LPG2 in the indicated cell types. Results are expressed as mean ± S.D. E, distribution of the Golgi marker protein, LPG2, in cells co-expressing LdRab1 or its mutant by immunoelectron microscopy.

