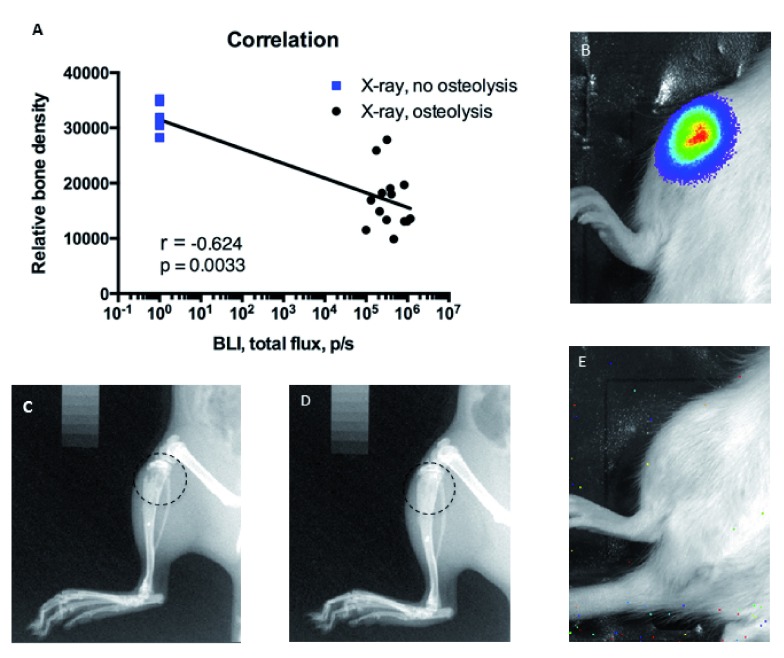
Figure 6. Correlation between relative bone density and bioluminescence signal.
( A) Animals without bioluminescence signal all had high relative bone density (blue), whereas animals with high bioluminescence signal demonstrated low relative bone density (black). Examples of osteolytic ( C) and non-osteolytic bone ( D). Examples of high bioluminescence signal ( B) and lack of signal ( E).

